- Home >
- Stock Photos >
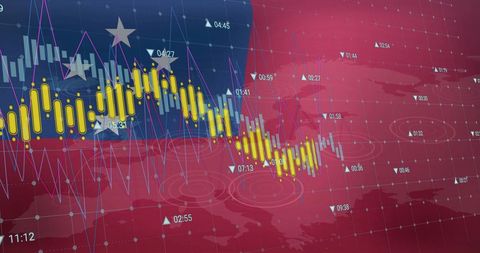
- Global Data with Graph and Digital Interface Elements
Global Data with Graph and Digital Interface Elements Image

Depicts innovative design integrating data visualization elements over a global map. Visualization showcases global economic or financial graph trends. Elements like crosses and QR codes introduce advanced communication technology themes. Suitable for illustrating concepts about global analytics, information processing frameworks, modern digital communications, and economic trend analysis in presentations or articles.

downloads
Tags:
More
Credit Photo
If you would like to credit the Photo, here are some ways you can do so
Text Link
photo Link
<span class="text-link">
<span>
<a target="_blank" href=https://pikwizard.com/photo/global-data-with-graph-and-digital-interface-elements/ca351e707ee83267e73fffa28bb12373/>PikWizard</a>
</span>
</span>
<span class="image-link">
<span
style="margin: 0 0 20px 0; display: inline-block; vertical-align: middle; width: 100%;"
>
<a
target="_blank"
href="https://pikwizard.com/photo/global-data-with-graph-and-digital-interface-elements/ca351e707ee83267e73fffa28bb12373/"
style="text-decoration: none; font-size: 10px; margin: 0;"
>
<img src="https://pikwizard.com/pw/medium/ca351e707ee83267e73fffa28bb12373.jpg" style="margin: 0; width: 100%;" alt="" />
<p style="font-size: 12px; margin: 0;">PikWizard</p>
</a>
</span>
</span>
Free (free of charge)
Free for personal and commercial use.
Author: Creative Art