
- Home >
- Stock Photos >
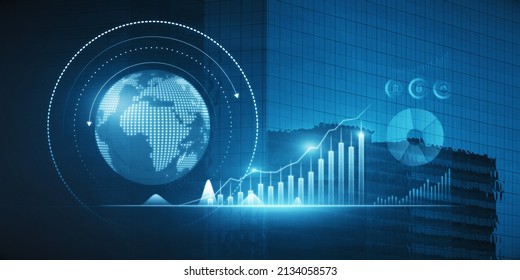
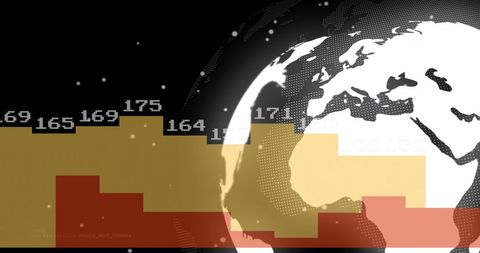
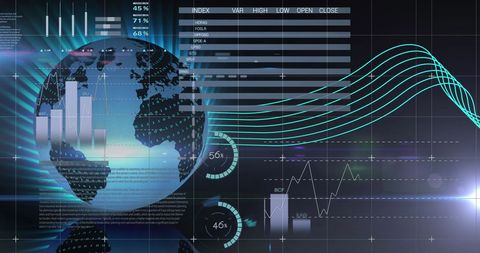
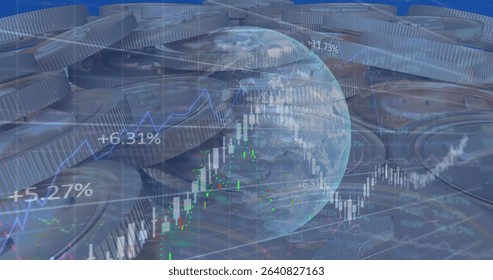
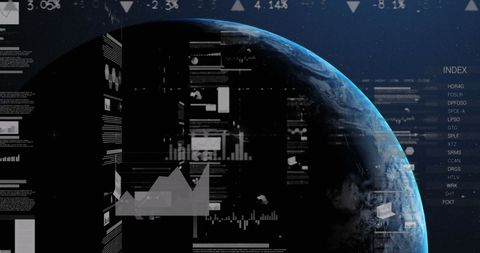
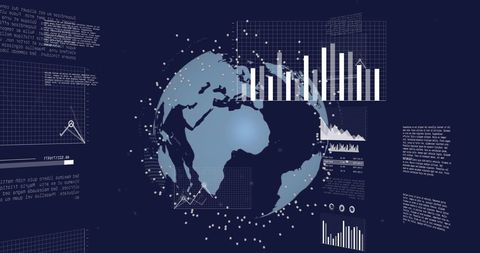
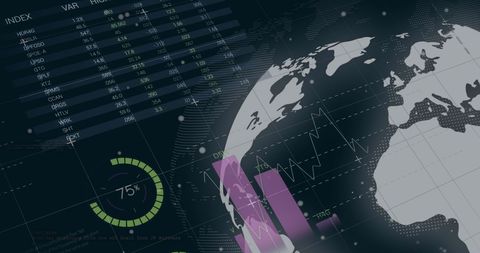
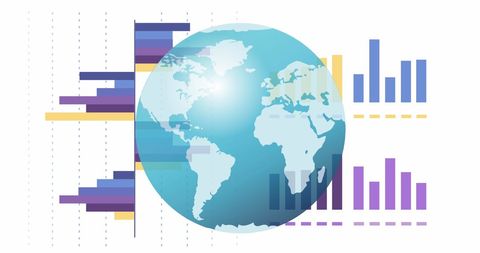
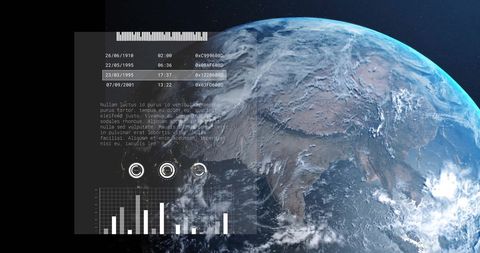
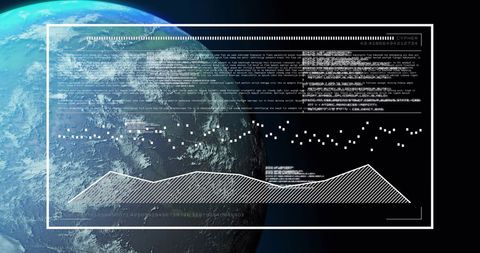
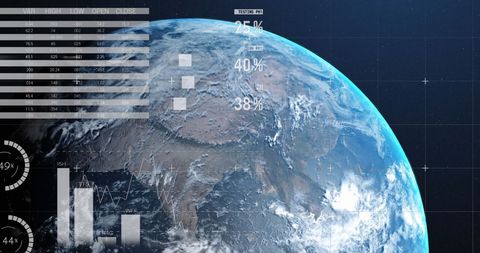
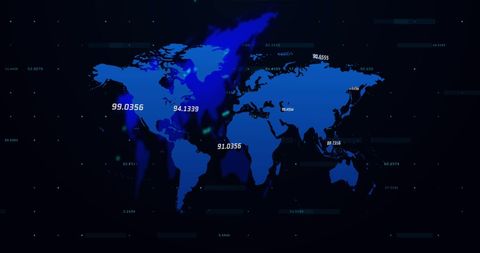
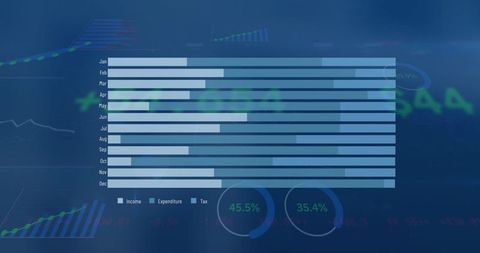
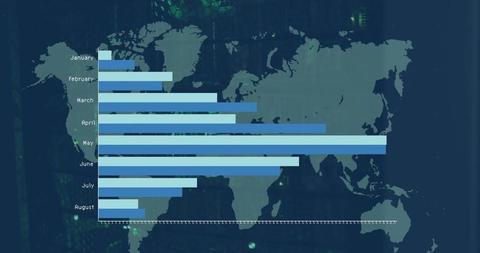
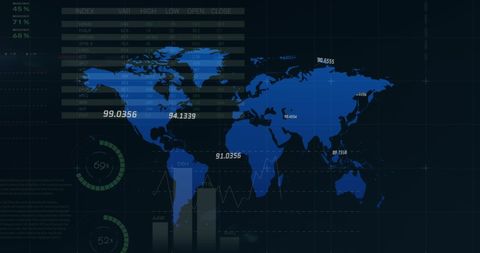
- Global Digital Data Visualization with Financial Bar Graph
Global Digital Data Visualization with Financial Bar Graph Image

Visualization displays bar graph over globe showing monthly financial data patterns, illustrating global connections with elements of modern technology. Ideal for presentations on international finance, digital data processing trends, or virtual economic studies.
Powered by  - Get 15% off with code: PIKWIZARD15


downloads
Tags:
More
Credit Photo
If you would like to credit the Photo, here are some ways you can do so
Text Link
photo Link
<span class="text-link">
<span>
<a target="_blank" href=https://pikwizard.com/photo/global-digital-data-visualization-with-financial-bar-graph/1c4cece33ce0426df5869ea6de3834d6/>PikWizard</a>
</span>
</span>
<span class="image-link">
<span
style="margin: 0 0 20px 0; display: inline-block; vertical-align: middle; width: 100%;"
>
<a
target="_blank"
href="https://pikwizard.com/photo/global-digital-data-visualization-with-financial-bar-graph/1c4cece33ce0426df5869ea6de3834d6/"
style="text-decoration: none; font-size: 10px; margin: 0;"
>
<img src="https://pikwizard.com/pw/medium/1c4cece33ce0426df5869ea6de3834d6.jpg" style="margin: 0; width: 100%;" alt="" />
<p style="font-size: 12px; margin: 0;">PikWizard</p>
</a>
</span>
</span>
Free (free of charge)
Free for personal and commercial use.
Author: Awesome Content
Similar Free Stock Images
Premium


Premium


Premium


Premium


Premium


Premium


Premium

Premium


Premium


Premium


Premium


Premium

Premium


Premium

Premium


Premium

Premium

Premium


Premium


Premium


Premium


Premium


Premium

Premium

Premium

Explore More Free Stock Images