- Home >
- Stock Photos >
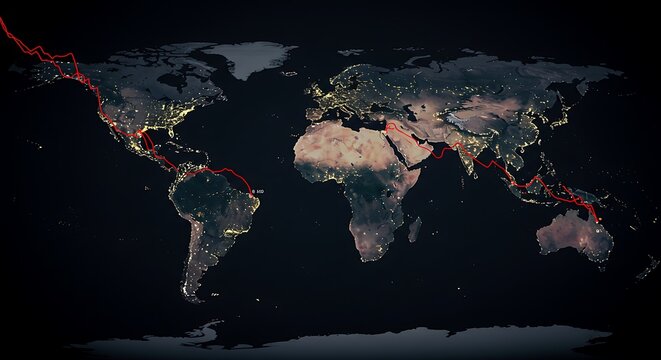
- Global Downturn Depicted with Declining Red Graph Overlaying World Map
Global Downturn Depicted with Declining Red Graph Overlaying World Map Image
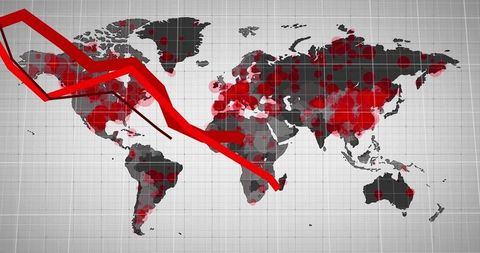
Visual representation illustrating economic decline with a red graph overlay on a world map. Bright red lines signify decreasing trends intersecting parts of the globe, suggesting widespread issues affecting worldwide economies. Suitable for use in presentations, articles, and reports focused on global economic challenges and financial market analysis.
Powered by 


2
downloads
downloads
Tags:
More
Credit Photo
If you would like to credit the Photo, here are some ways you can do so
Text Link
photo Link
<span class="text-link">
<span>
<a target="_blank" href=https://pikwizard.com/photo/global-downturn-depicted-with-declining-red-graph-overlaying-world-map/de6f325f536f4c661a0477e64547b1fb/>PikWizard</a>
</span>
</span>
<span class="image-link">
<span
style="margin: 0 0 20px 0; display: inline-block; vertical-align: middle; width: 100%;"
>
<a
target="_blank"
href="https://pikwizard.com/photo/global-downturn-depicted-with-declining-red-graph-overlaying-world-map/de6f325f536f4c661a0477e64547b1fb/"
style="text-decoration: none; font-size: 10px; margin: 0;"
>
<img src="https://pikwizard.com/pw/medium/de6f325f536f4c661a0477e64547b1fb.jpg" style="margin: 0; width: 100%;" alt="" />
<p style="font-size: 12px; margin: 0;">PikWizard</p>
</a>
</span>
</span>
Free (free of charge)
Free for personal and commercial use.
Author: Authentic Images
Similar Free Stock Images

Premium


Premium


Premium


Premium


Premium


Premium


Premium


Premium


Premium


Premium


Premium


Premium


Premium


Premium


Premium


Premium


Premium


Premium


Premium


Premium


Premium


Premium


Premium


Premium