
- Home >
- Stock Photos >
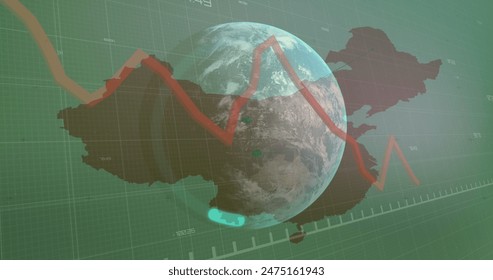
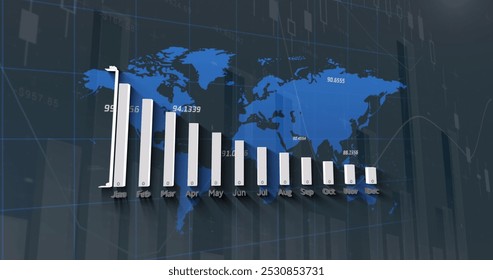
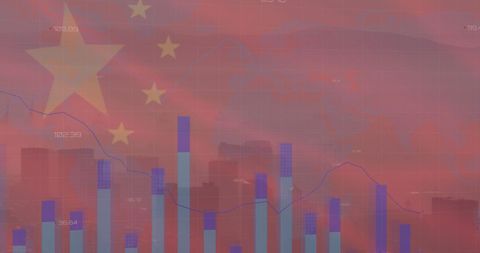
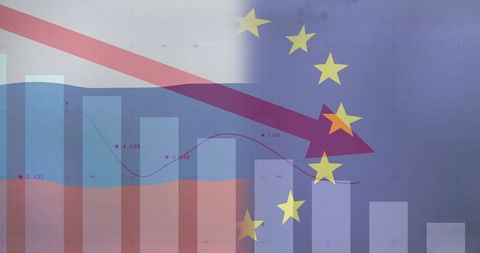
- Global Economic Data Visualization with Map Overlay and Bar Graphs
Global Economic Data Visualization with Map Overlay and Bar Graphs Image

Colorful infographic with overlay of bar graphs intersecting a world map. Designed to represent global economic trends and analysis. Ideal for articles on international finance, business presentations, and educational materials aimed at illustrating worldwide economic indicators and insights.
Powered by  - Get 15% off with code: PIKWIZARD15


downloads
Tags:
More
Credit Photo
If you would like to credit the Photo, here are some ways you can do so
Text Link
photo Link
<span class="text-link">
<span>
<a target="_blank" href=https://pikwizard.com/photo/global-economic-data-visualization-with-map-overlay-and-bar-graphs/61d24fb41d85caa48b0869cec9be6b7c/>PikWizard</a>
</span>
</span>
<span class="image-link">
<span
style="margin: 0 0 20px 0; display: inline-block; vertical-align: middle; width: 100%;"
>
<a
target="_blank"
href="https://pikwizard.com/photo/global-economic-data-visualization-with-map-overlay-and-bar-graphs/61d24fb41d85caa48b0869cec9be6b7c/"
style="text-decoration: none; font-size: 10px; margin: 0;"
>
<img src="https://pikwizard.com/pw/medium/61d24fb41d85caa48b0869cec9be6b7c.jpg" style="margin: 0; width: 100%;" alt="" />
<p style="font-size: 12px; margin: 0;">PikWizard</p>
</a>
</span>
</span>
Free (free of charge)
Free for personal and commercial use.
Author: People Creations
Similar Free Stock Images

Premium


Premium

Premium


Premium


Premium

Premium


Premium
Premium

Premium


Premium

Premium


Premium

Premium


Premium


Premium


Premium


Premium


Premium


Premium


Premium


Premium


Premium

Premium


Premium

Premium


Explore More Free Stock Images