
- Home >
- Stock Photos >
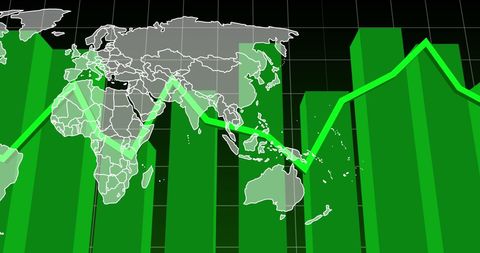
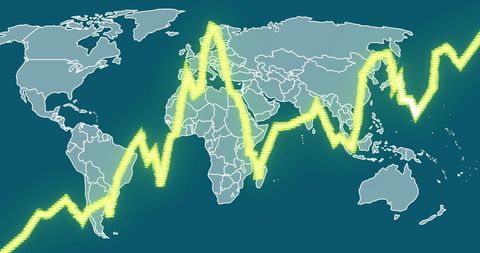
- Global Economic Data Visualization with World Map and Chart
Global Economic Data Visualization with World Map and Chart Image

This illustration shows a world map overlaid with a green line chart, symbolizing global economic trends and data analysis. Suitable for articles, reports, and presentations on international business, economic data analysis, or financial forecasts. Graphics like this attract readers interested in global markets and provide visual insights on economic patterns.
Powered by 


downloads
Tags:
More
Credit Photo
If you would like to credit the Photo, here are some ways you can do so
Text Link
photo Link
<span class="text-link">
<span>
<a target="_blank" href=https://pikwizard.com/photo/global-economic-data-visualization-with-world-map-and-chart/3c107feee4bc55d5745d4443bfff1115/>PikWizard</a>
</span>
</span>
<span class="image-link">
<span
style="margin: 0 0 20px 0; display: inline-block; vertical-align: middle; width: 100%;"
>
<a
target="_blank"
href="https://pikwizard.com/photo/global-economic-data-visualization-with-world-map-and-chart/3c107feee4bc55d5745d4443bfff1115/"
style="text-decoration: none; font-size: 10px; margin: 0;"
>
<img src="https://pikwizard.com/pw/medium/3c107feee4bc55d5745d4443bfff1115.jpg" style="margin: 0; width: 100%;" alt="" />
<p style="font-size: 12px; margin: 0;">PikWizard</p>
</a>
</span>
</span>
Free (free of charge)
Free for personal and commercial use.
Author: Creative Art
Similar Free Stock Images
Premium


Premium

Premium


Premium


Premium


Premium


Premium


Premium

Premium

Premium

Premium


Premium


Premium


Premium


Premium


Premium


Premium


Premium


Premium

Premium

Premium

Premium


Premium


Premium


Premium


Explore More Free Stock Images