
- Home >
- Stock Photos >
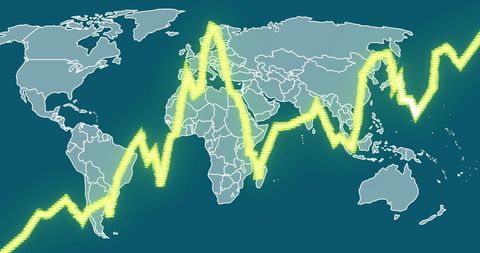
- Global Economic Downturn with Digital Interface
Global Economic Downturn with Digital Interface Image

Visual representation of global economic downturn conveyed through red negative trend line overlay and digital elements. Globe emphasizes global impact while digital backdrop suggests technological analytics. Useful for presentations on international economics, business risk analysis, or financial tech.
Powered by  - Get 15% off with code: PIKWIZARD15


downloads
Tags:
More
Credit Photo
If you would like to credit the Photo, here are some ways you can do so
Text Link
photo Link
<span class="text-link">
<span>
<a target="_blank" href=https://pikwizard.com/photo/global-economic-downturn-with-digital-interface/1bebf1e06d98a82ecc2cc6857e125fa0/>PikWizard</a>
</span>
</span>
<span class="image-link">
<span
style="margin: 0 0 20px 0; display: inline-block; vertical-align: middle; width: 100%;"
>
<a
target="_blank"
href="https://pikwizard.com/photo/global-economic-downturn-with-digital-interface/1bebf1e06d98a82ecc2cc6857e125fa0/"
style="text-decoration: none; font-size: 10px; margin: 0;"
>
<img src="https://pikwizard.com/pw/medium/1bebf1e06d98a82ecc2cc6857e125fa0.jpg" style="margin: 0; width: 100%;" alt="" />
<p style="font-size: 12px; margin: 0;">PikWizard</p>
</a>
</span>
</span>
Free (free of charge)
Free for personal and commercial use.
Author: People Creations
Similar Free Stock Images

Premium


Premium


Premium


Premium
Premium

Premium


Premium

Premium


Premium


Premium

Premium


Premium

Premium


Premium


Premium


Premium


Premium


Premium


Premium


Premium


Premium


Premium


AI


Premium


Premium

Premium

Explore More Free Stock Images