- Home >
- Stock Photos >
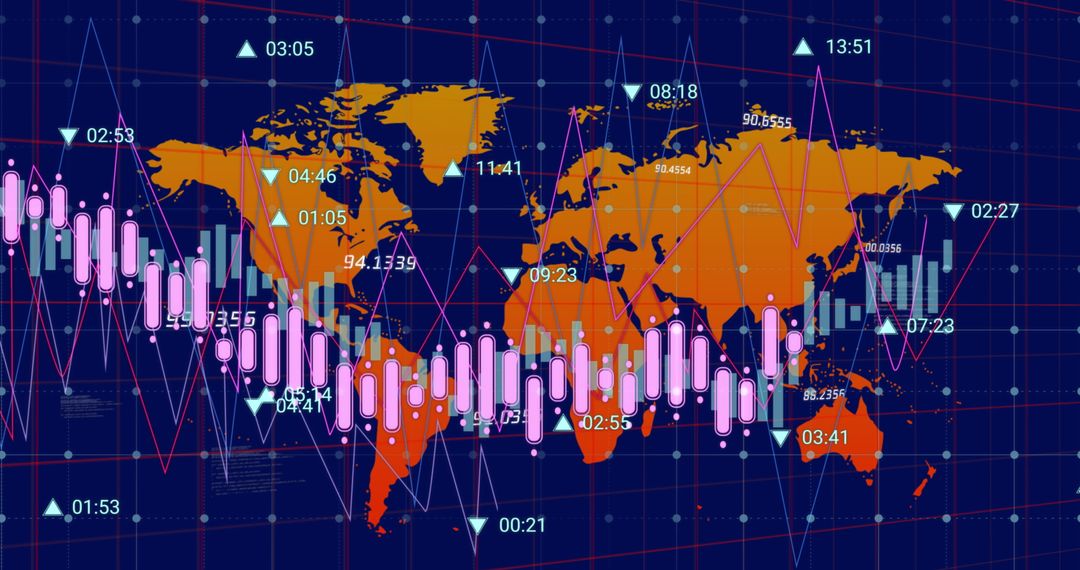
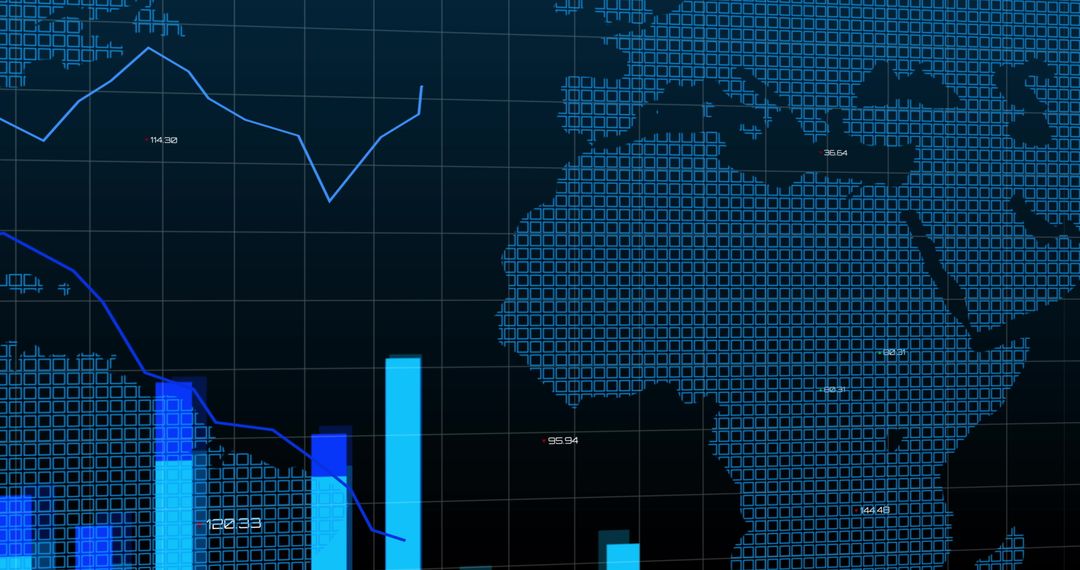
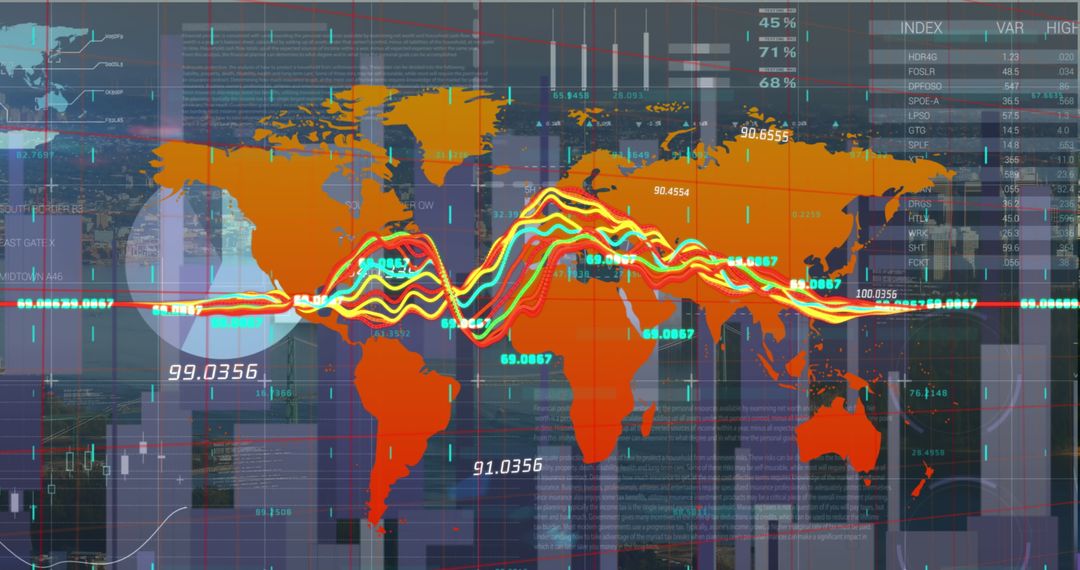
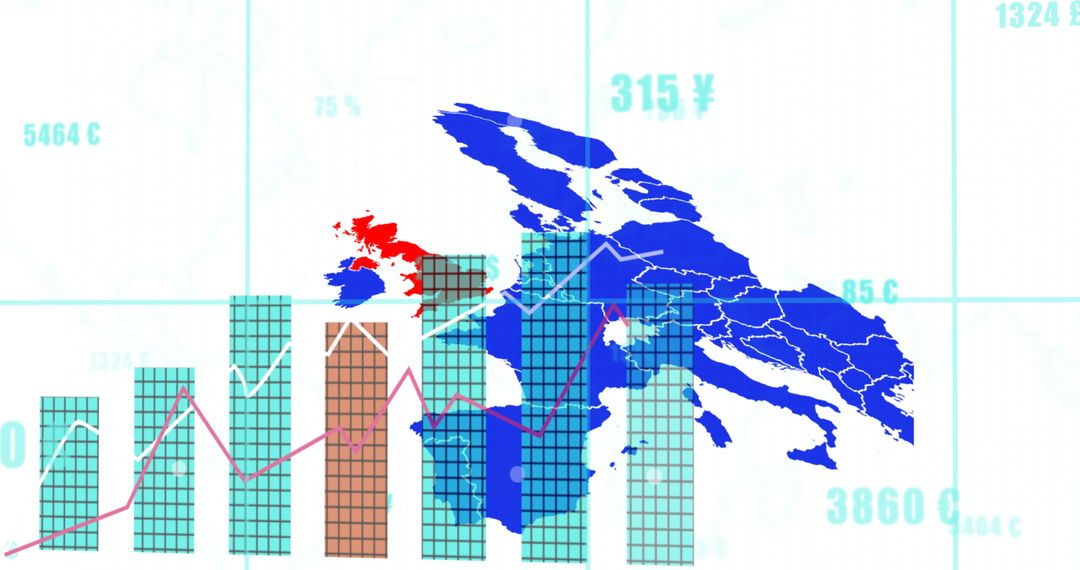
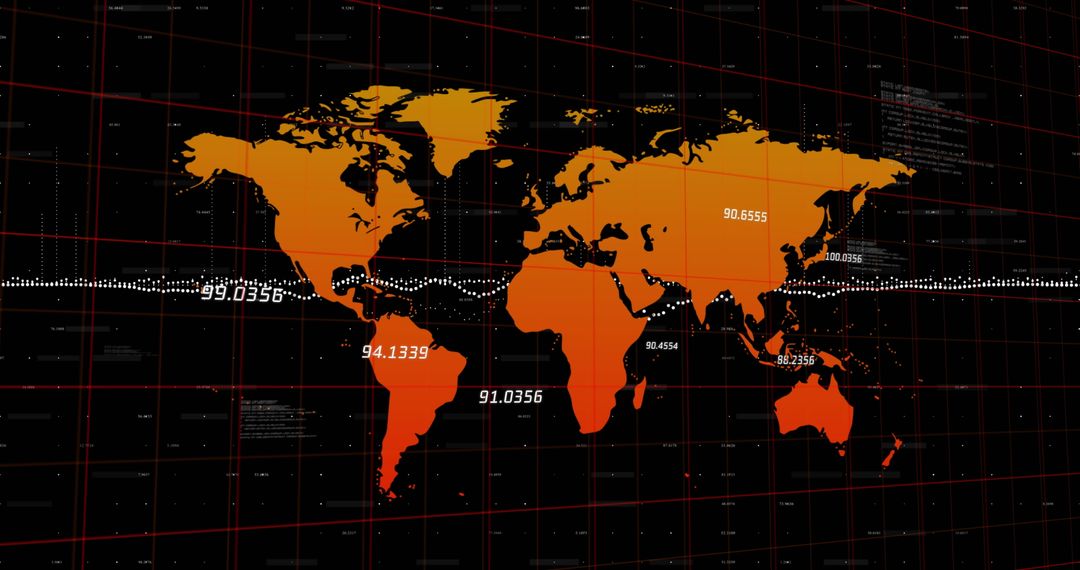
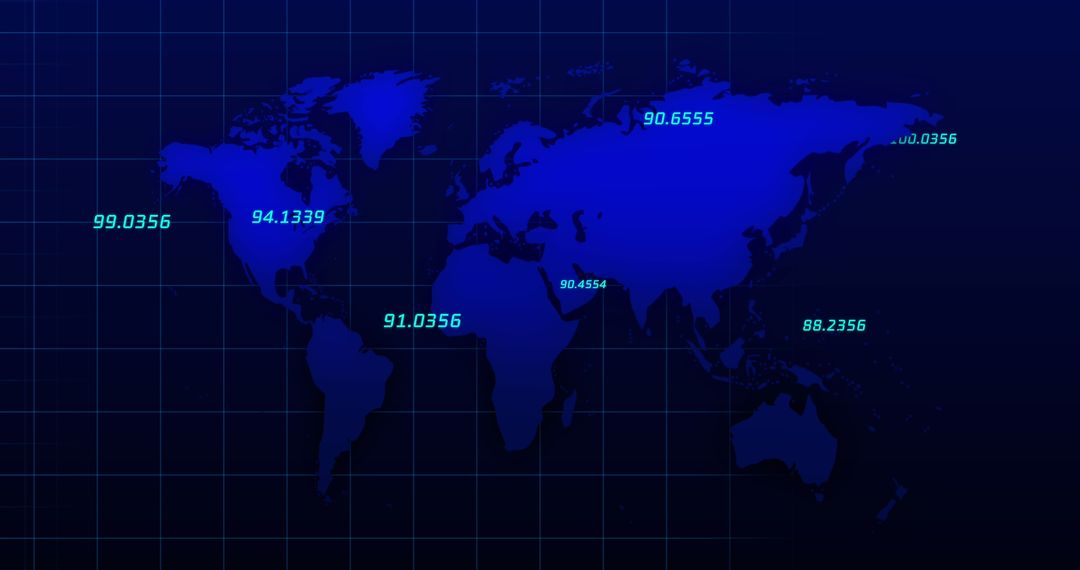
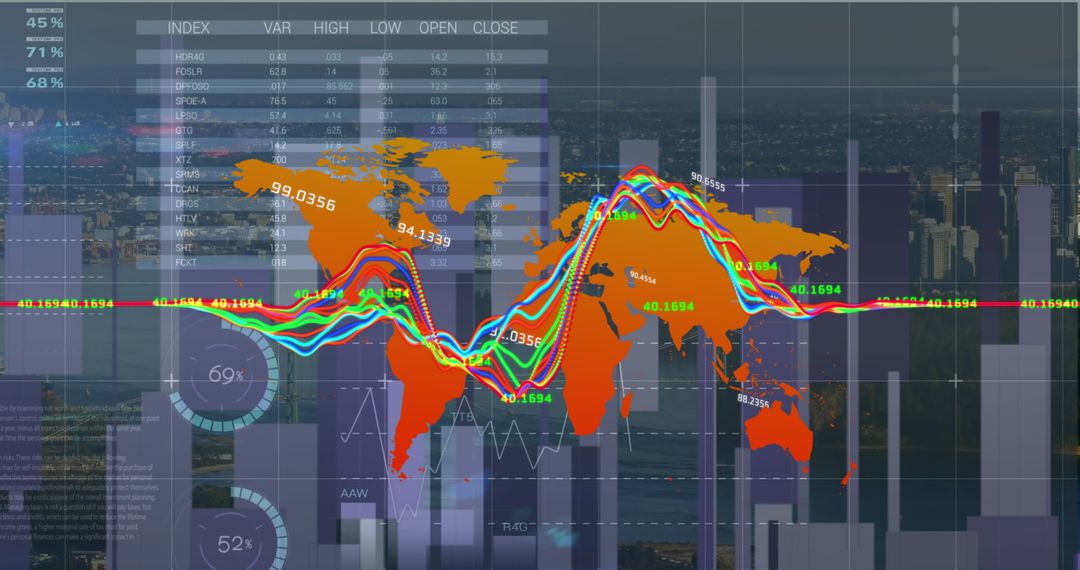
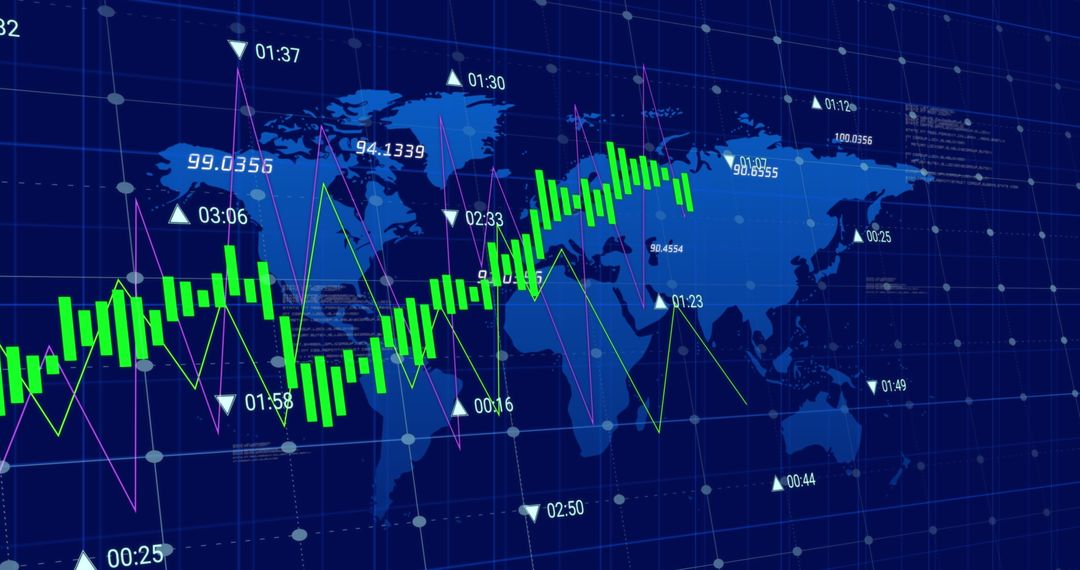
- Global Economic Growth Representation with Line and Bar Graphs
Global Economic Growth Representation with Line and Bar Graphs Image
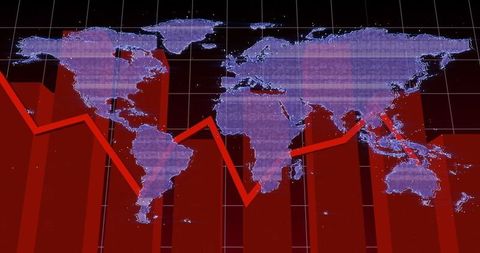
Global map overlaid with rising bar graph and red line chart indicative of financial trends. Suggests economic growth or insights for analytics reports. Ideal for financial presentations, technology blogs, and digital infographics to display trends, strategies, or statistical analysis.
Powered by 


0
downloads
downloads
Tags:
More
Credit Photo
If you would like to credit the Photo, here are some ways you can do so
Text Link
photo Link
<span class="text-link">
<span>
<a target="_blank" href=https://pikwizard.com/photo/global-economic-growth-representation-with-line-and-bar-graphs/459b82bebf086bcfcaa2f75e716fa27d/>PikWizard</a>
</span>
</span>
<span class="image-link">
<span
style="margin: 0 0 20px 0; display: inline-block; vertical-align: middle; width: 100%;"
>
<a
target="_blank"
href="https://pikwizard.com/photo/global-economic-growth-representation-with-line-and-bar-graphs/459b82bebf086bcfcaa2f75e716fa27d/"
style="text-decoration: none; font-size: 10px; margin: 0;"
>
<img src="https://pikwizard.com/pw/medium/459b82bebf086bcfcaa2f75e716fa27d.jpg" style="margin: 0; width: 100%;" alt="" />
<p style="font-size: 12px; margin: 0;">PikWizard</p>
</a>
</span>
</span>
Free (free of charge)
Free for personal and commercial use.
Author: Authentic Images
Similar Free Stock Images

Premium


Premium


Premium


Premium


Premium


Premium


Premium


Premium


Premium


Premium


Premium


Premium


Premium


Premium


Premium


Premium


Premium


Premium


Premium


Premium


Premium


Premium


Premium


Premium