- Home >
- Stock Photos >
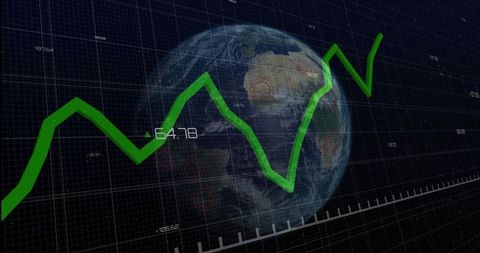
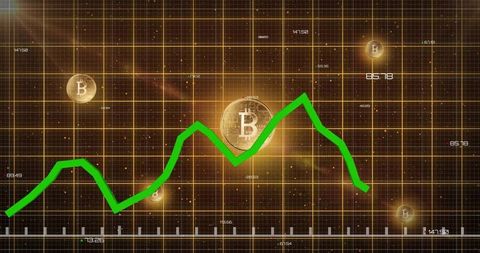
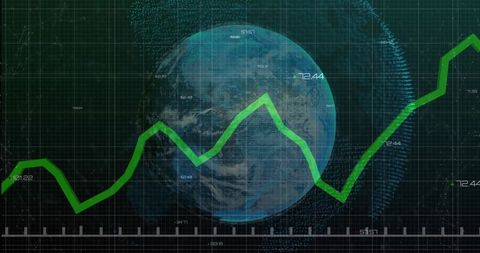
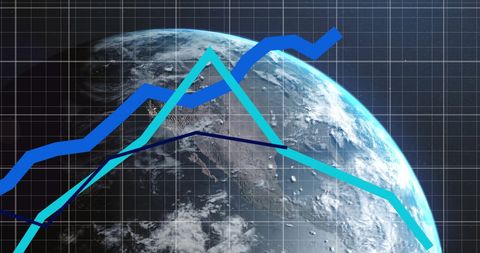
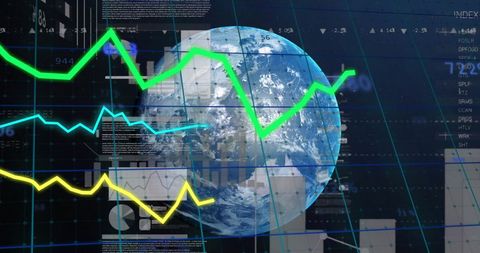
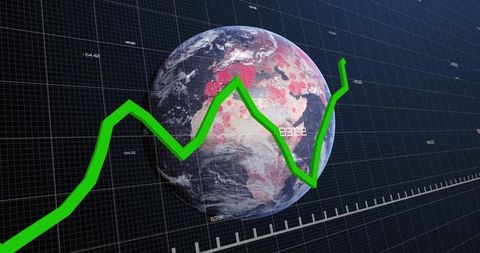
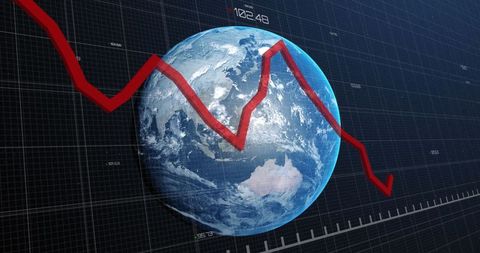
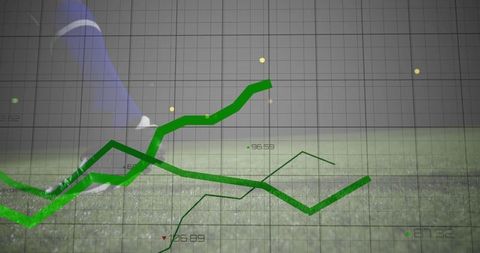
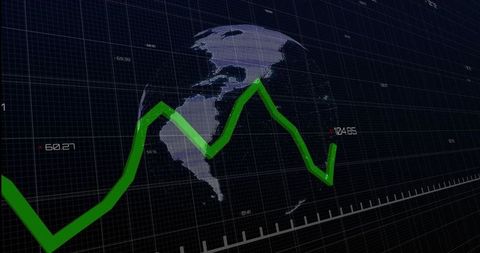
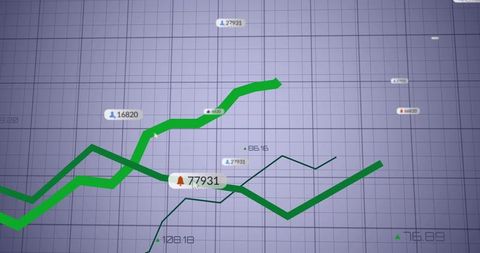
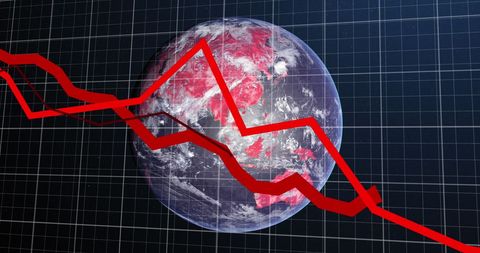
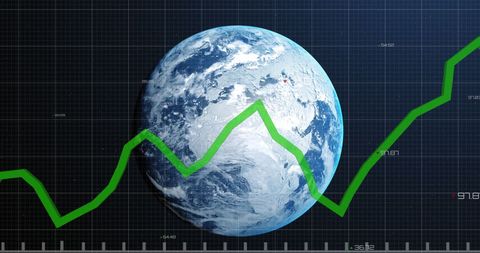
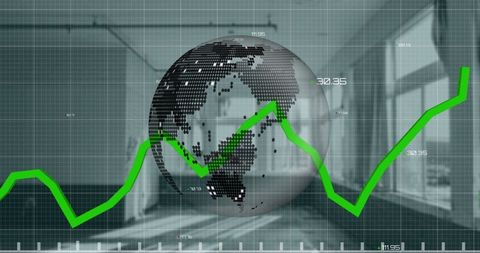
- Global Economic Trends with Green Line Graph
Global Economic Trends with Green Line Graph Image
Green trending lines travel across a globe mapped on a grid display, symbolizing economic and financial data evolution. Numeric markers indicate data points, giving insight into analytical conclusions and predictions. Useful for presentations and content focused on global finance, technological advancements in data analysis, or market research reporting.
Powered by  - Get 15% off with code: PIKWIZARD15


0
downloads
downloads
Tags:
More
Credit Photo
If you would like to credit the Photo, here are some ways you can do so
Text Link
photo Link
<span class="text-link">
<span>
<a target="_blank" href=https://pikwizard.com/photo/global-economic-trends-with-green-line-graph/12fb185e71a1bd0798b124cbdfc3c320/>PikWizard</a>
</span>
</span>
<span class="image-link">
<span
style="margin: 0 0 20px 0; display: inline-block; vertical-align: middle; width: 100%;"
>
<a
target="_blank"
href="https://pikwizard.com/photo/global-economic-trends-with-green-line-graph/12fb185e71a1bd0798b124cbdfc3c320/"
style="text-decoration: none; font-size: 10px; margin: 0;"
>
<img src="https://pikwizard.com/pw/medium/12fb185e71a1bd0798b124cbdfc3c320.jpg" style="margin: 0; width: 100%;" alt="" />
<p style="font-size: 12px; margin: 0;">PikWizard</p>
</a>
</span>
</span>
Free (free of charge)
Free for personal and commercial use.
Author: Authentic Images
Similar Free Stock Images
Loading...

Premium


Premium

Premium


Premium

Premium


Premium


Premium


Premium

Premium

Premium
Premium


Premium

Premium

Premium


Premium


Premium


Premium


Premium


Premium


Premium


Premium

Premium


Premium

Premium


Premium