- Home >
- Stock Photos >
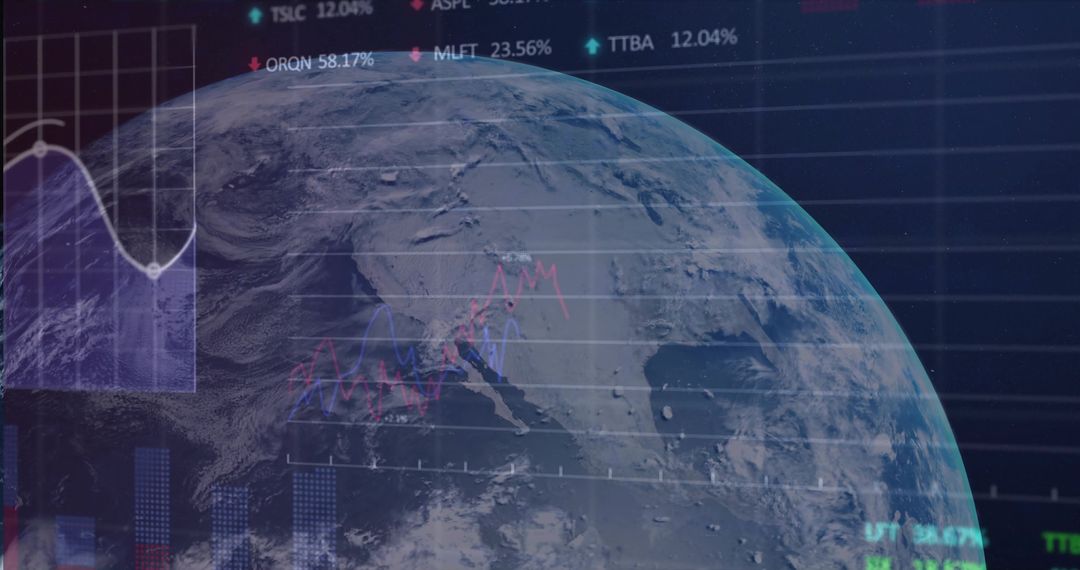
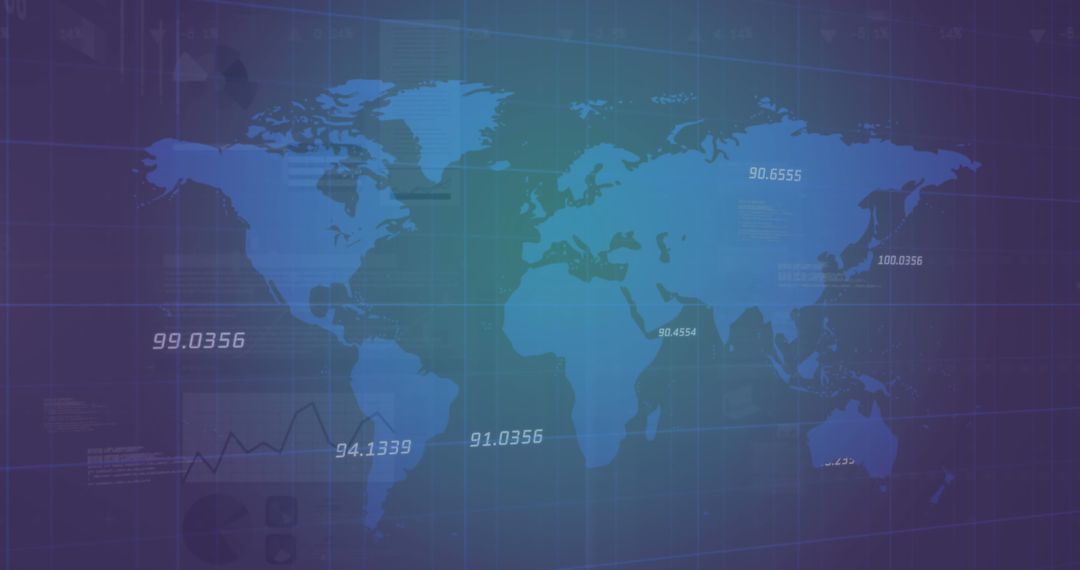
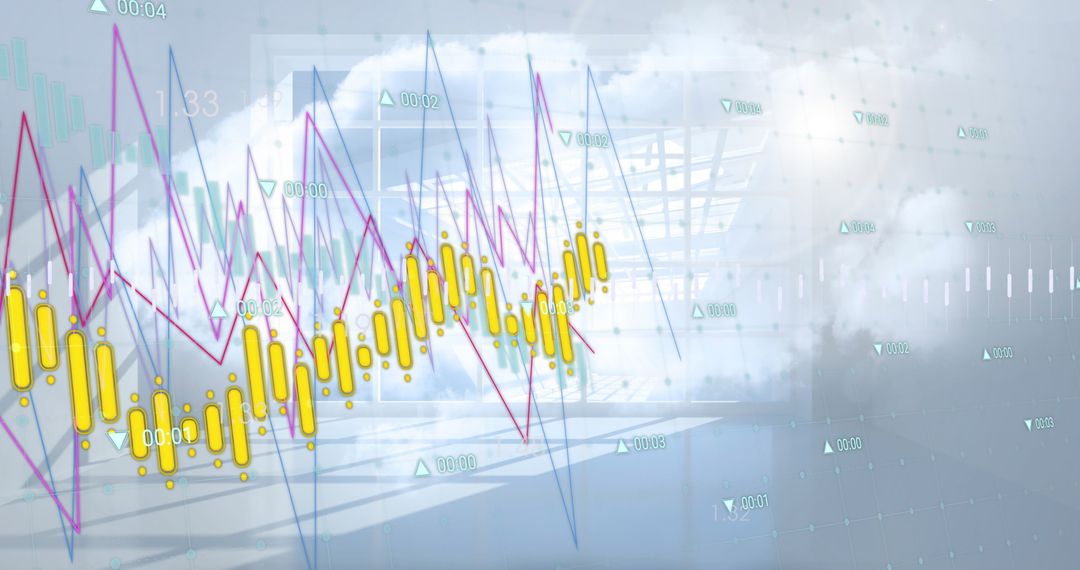
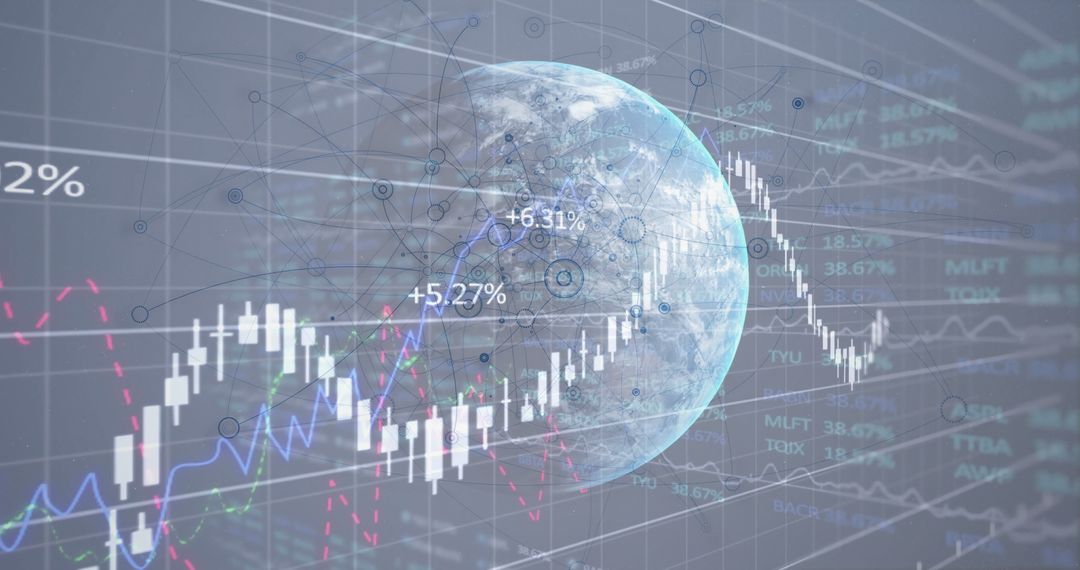
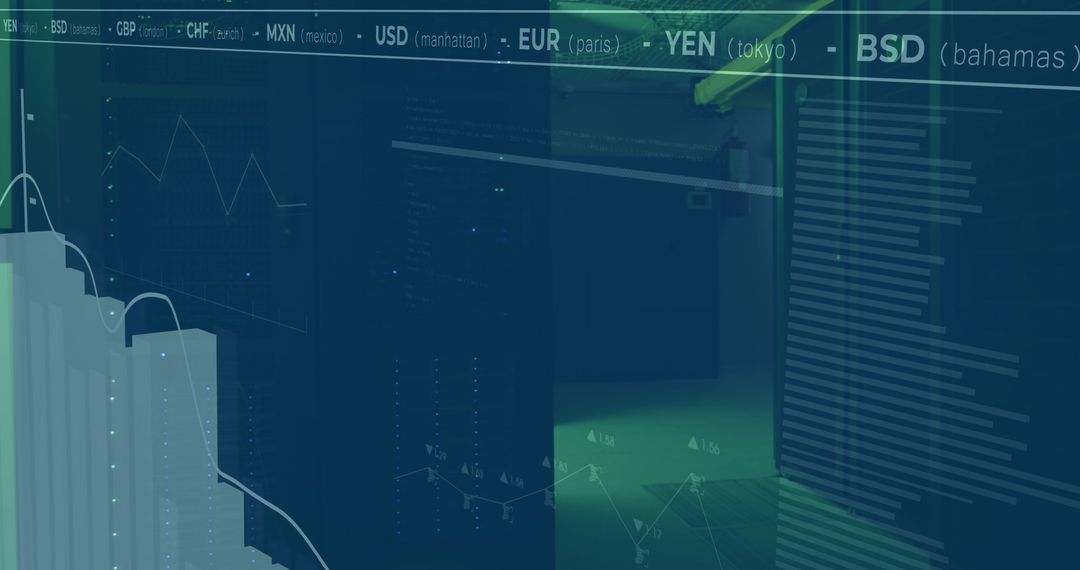
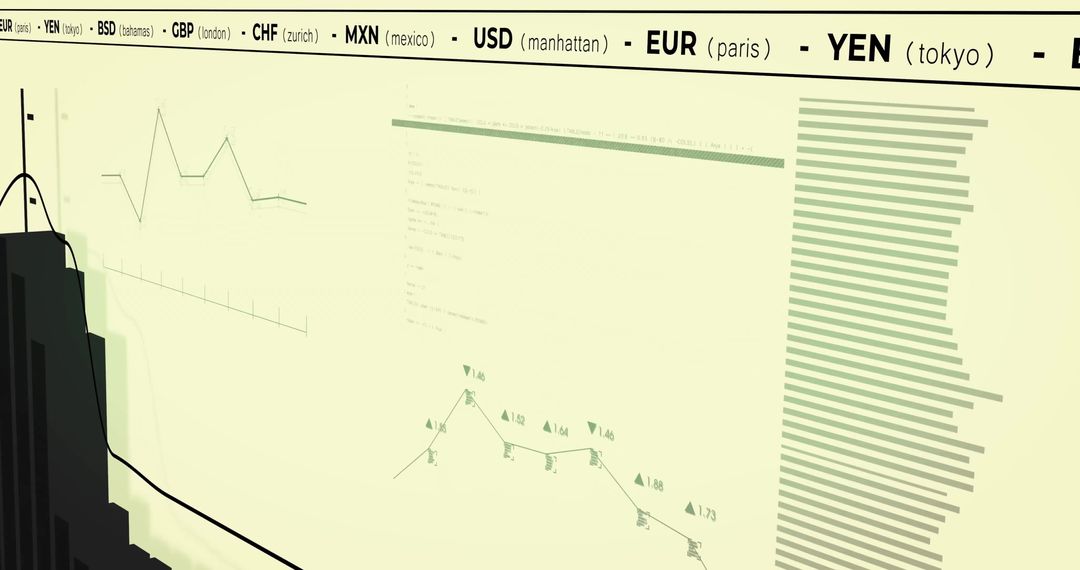
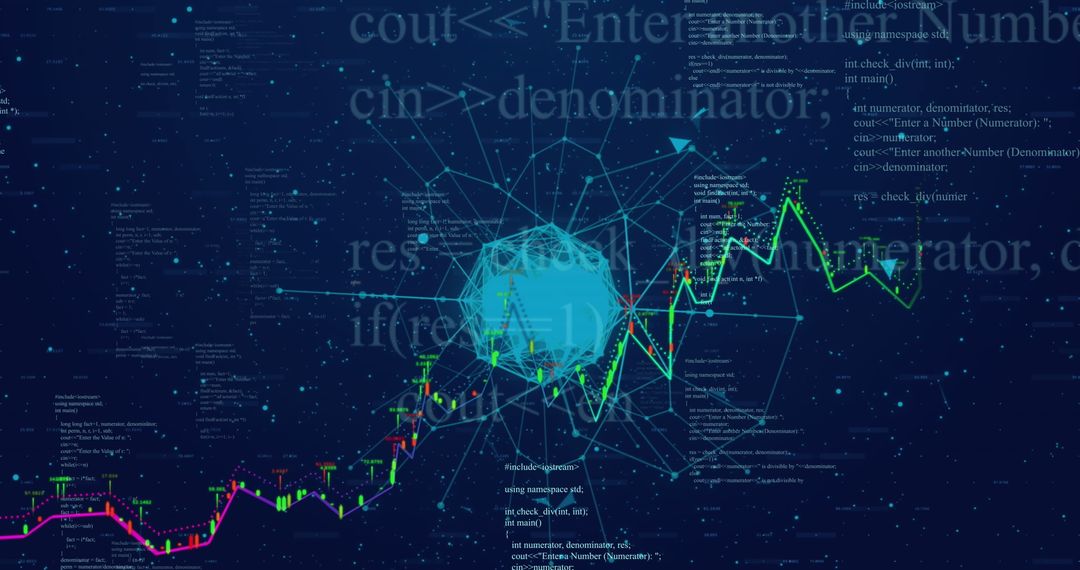
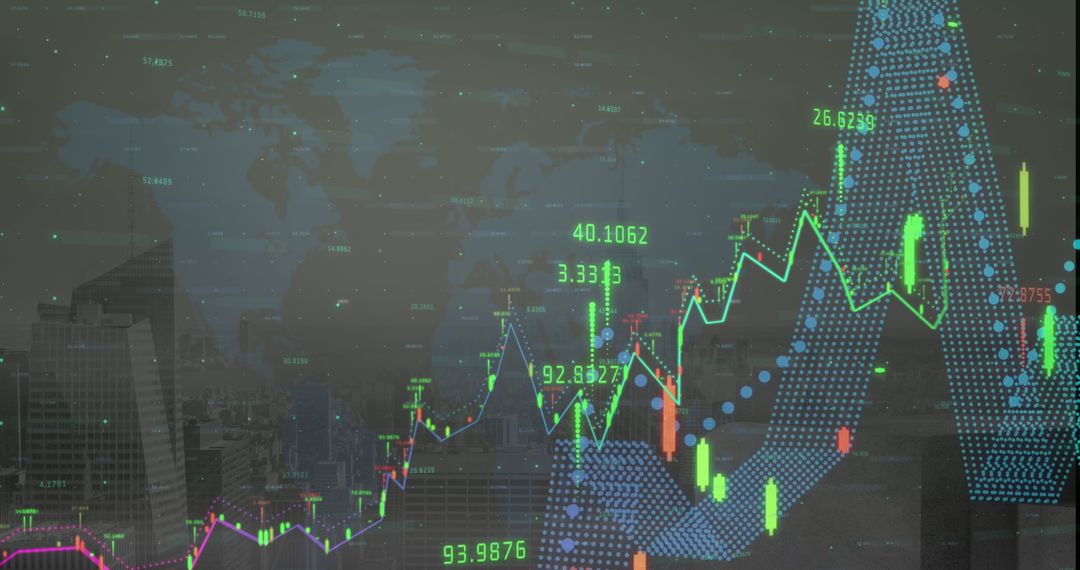
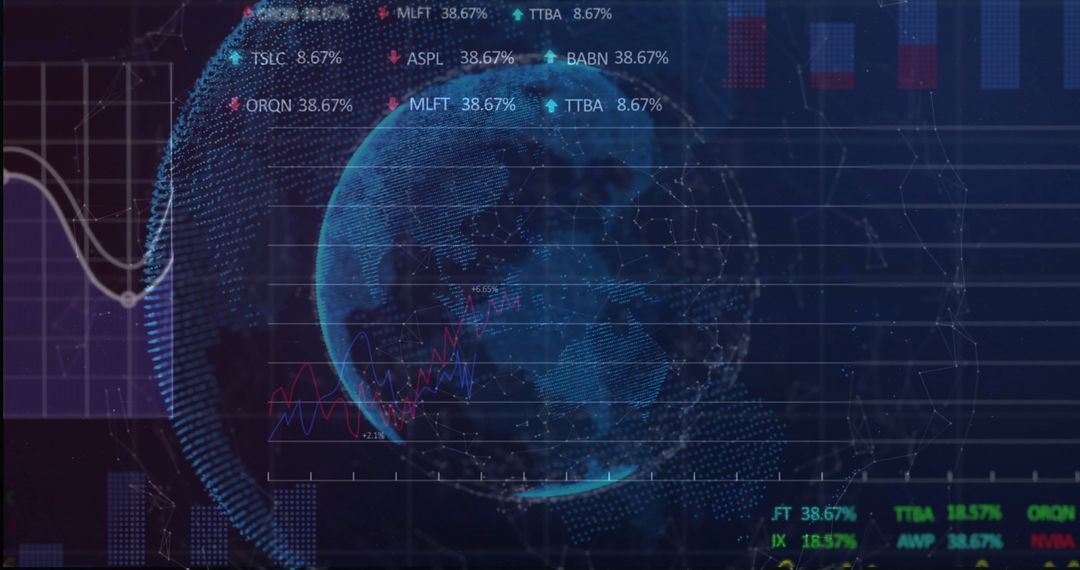
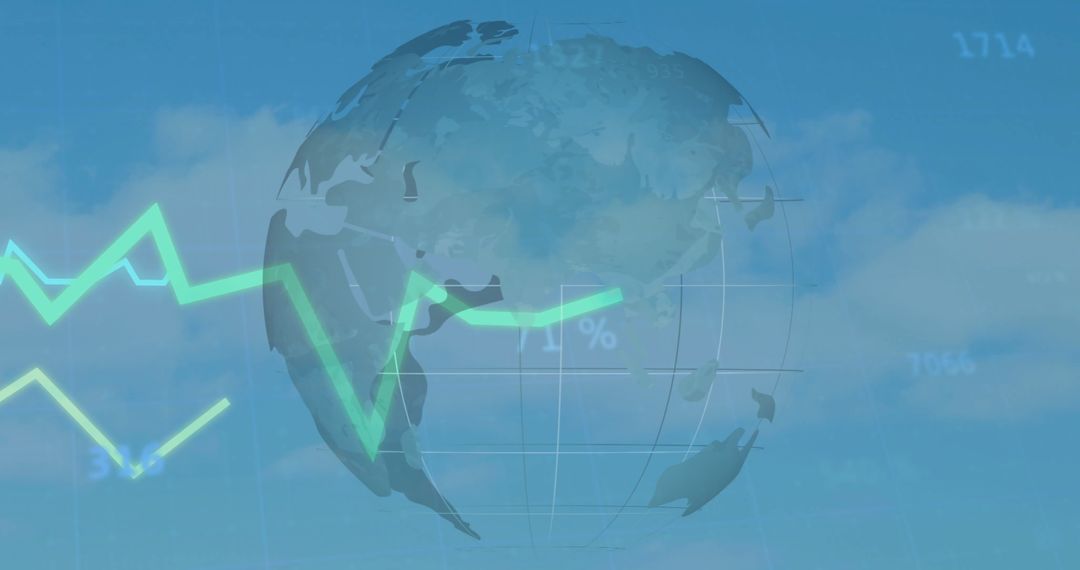
- Global Economy Analytics Dashboard with Currency and Statistics
Global Economy Analytics Dashboard with Currency and Statistics Image
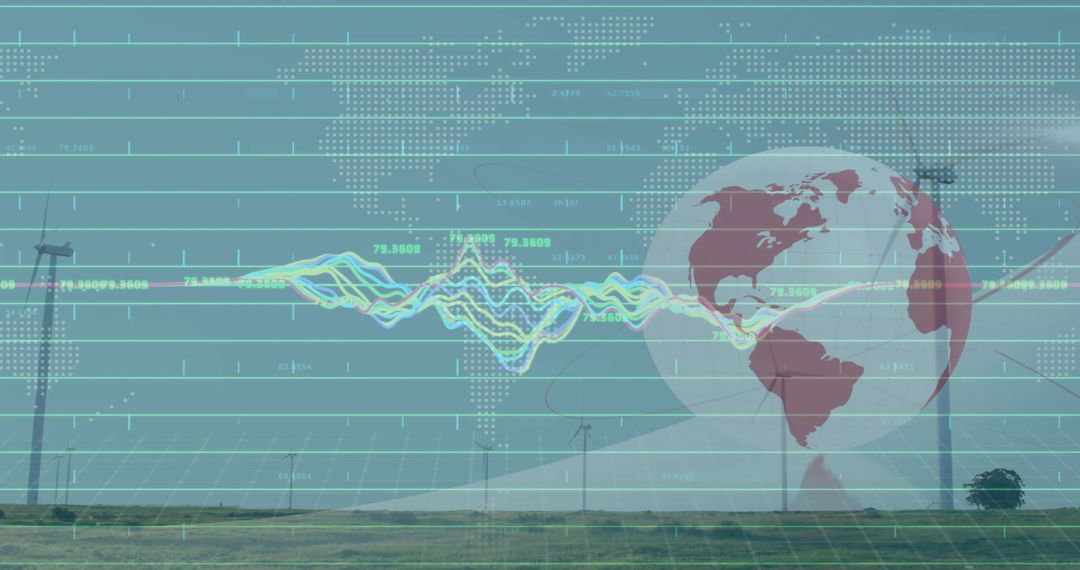
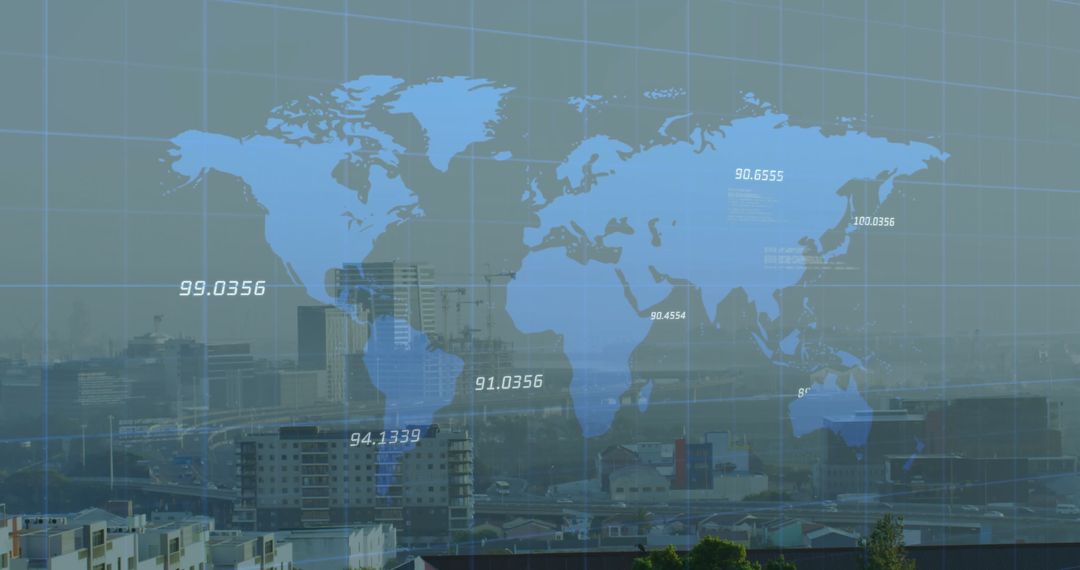
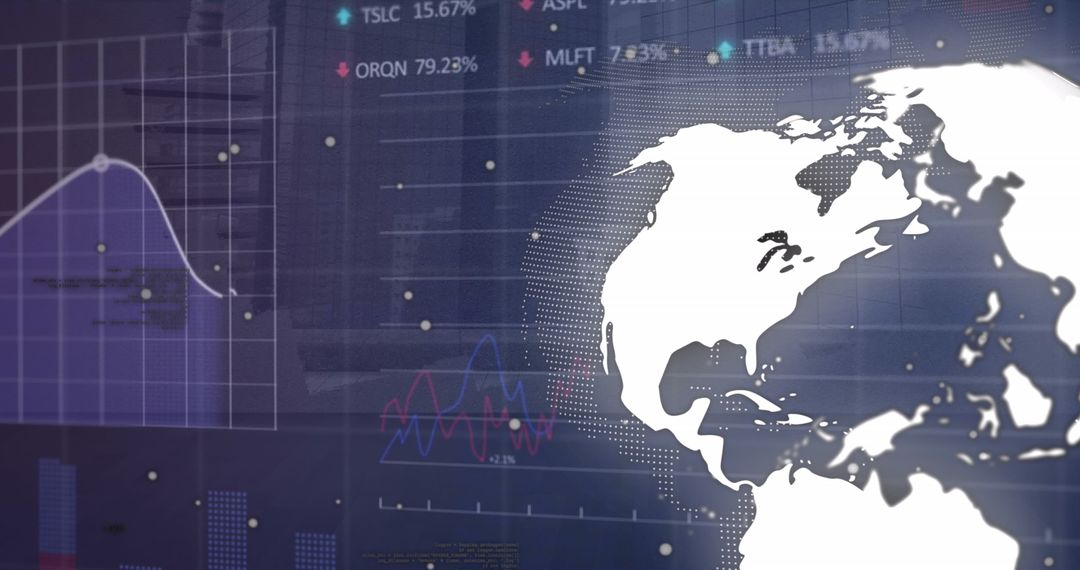
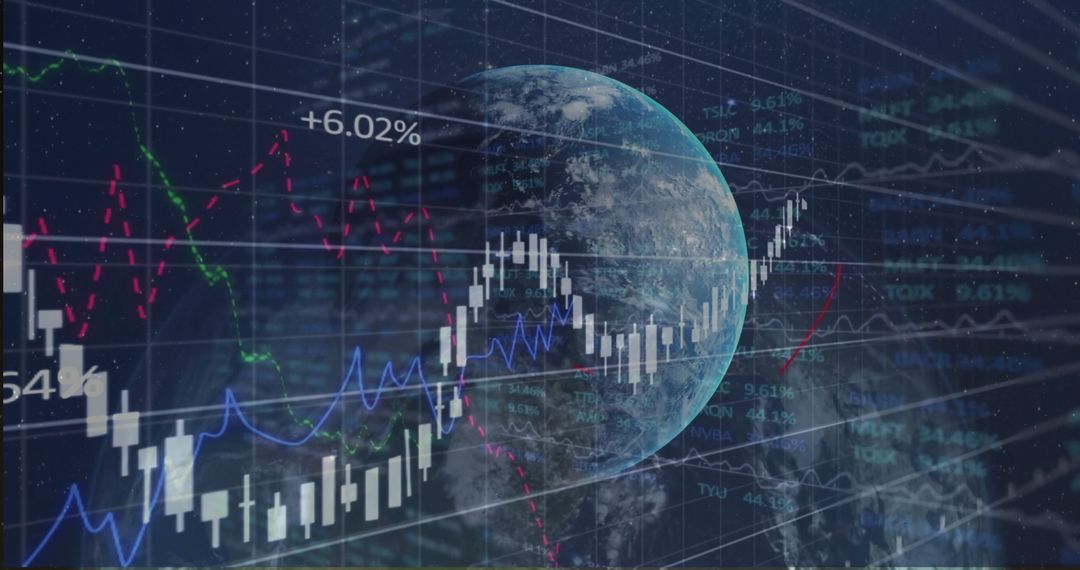
This futuristic illustration shows a digital dashboard displaying a mapping globe, representing Europe and Africa, alongside dynamic graphs and a currency ticker for USD, EUR, YEN, among others. It symbolizes advancements in finance technology and statistics. Ideal for blog posts, business presentations, and articles focusing on economic trends, innovation in digital analytics, and financial forecasting. A perfect visual aid for discussing global market analysis and fiscal strategies.
Powered by 


0
downloads
downloads
Tags:
More
Credit Photo
If you would like to credit the Photo, here are some ways you can do so
Text Link
photo Link
<span class="text-link">
<span>
<a target="_blank" href=https://pikwizard.com/photo/global-economy-analytics-dashboard-with-currency-and-statistics/8d393de00989cccaa54f4d548e4f610a/>PikWizard</a>
</span>
</span>
<span class="image-link">
<span
style="margin: 0 0 20px 0; display: inline-block; vertical-align: middle; width: 100%;"
>
<a
target="_blank"
href="https://pikwizard.com/photo/global-economy-analytics-dashboard-with-currency-and-statistics/8d393de00989cccaa54f4d548e4f610a/"
style="text-decoration: none; font-size: 10px; margin: 0;"
>
<img src="https://pikwizard.com/pw/medium/8d393de00989cccaa54f4d548e4f610a.jpg" style="margin: 0; width: 100%;" alt="" />
<p style="font-size: 12px; margin: 0;">PikWizard</p>
</a>
</span>
</span>
Free (free of charge)
Free for personal and commercial use.
Author: Authentic Images
Similar Free Stock Images

Premium


Premium


Premium


Premium


Premium


Premium


Premium


Premium


Premium


Premium