
- Home >
- Stock Photos >
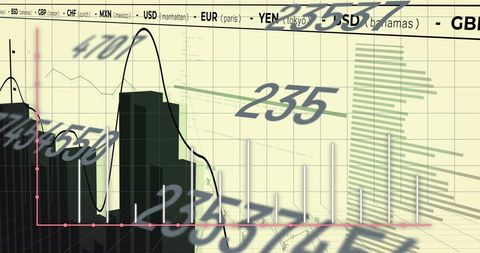
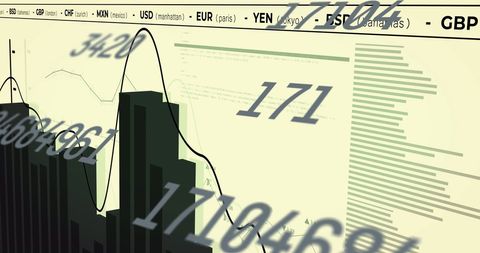
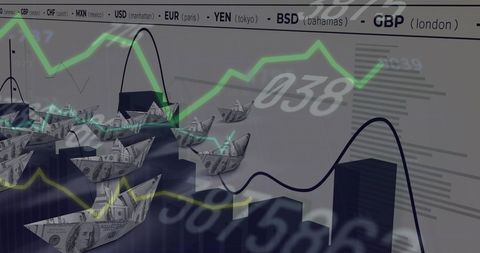
- Global Economy and Stock Market Data Concept Visualization
Global Economy and Stock Market Data Concept Visualization Image

This depicts fluctuating numbers and financial graphs, suggesting global financial analysis and stock market transactions. Ideal for use in articles on economic trends, business presentations, financial tech ads, investment guides, and market forecasting reports.
Powered by 


4
downloads
downloads
Tags:
More
Credit Photo
If you would like to credit the Photo, here are some ways you can do so
Text Link
photo Link
<span class="text-link">
<span>
<a target="_blank" href=https://pikwizard.com/photo/global-economy-and-stock-market-data-concept-visualization/90ccec18a2d92f418fad4cffcb4a43ca/>PikWizard</a>
</span>
</span>
<span class="image-link">
<span
style="margin: 0 0 20px 0; display: inline-block; vertical-align: middle; width: 100%;"
>
<a
target="_blank"
href="https://pikwizard.com/photo/global-economy-and-stock-market-data-concept-visualization/90ccec18a2d92f418fad4cffcb4a43ca/"
style="text-decoration: none; font-size: 10px; margin: 0;"
>
<img src="https://pikwizard.com/pw/medium/90ccec18a2d92f418fad4cffcb4a43ca.jpg" style="margin: 0; width: 100%;" alt="" />
<p style="font-size: 12px; margin: 0;">PikWizard</p>
</a>
</span>
</span>
Free (free of charge)
Free for personal and commercial use.
Author: People Creations
Similar Free Stock Images
Loading...

Premium


Premium


Premium


Premium


Premium

Premium


Premium

Premium


Premium

Premium


Premium


Premium

Premium


Premium

Premium


Premium


Premium


Premium


Premium


Premium

Premium


Premium


Premium


Premium


Premium
