
- Home >
- Stock Photos >
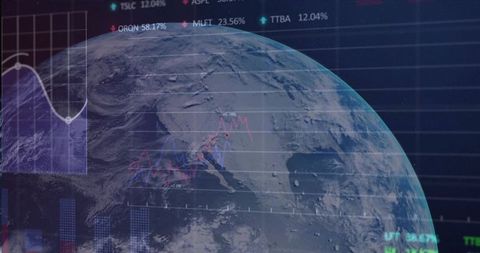
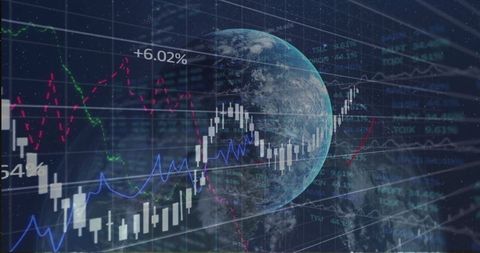
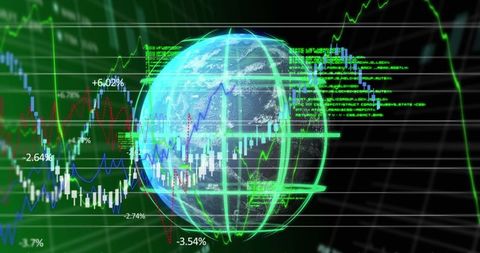
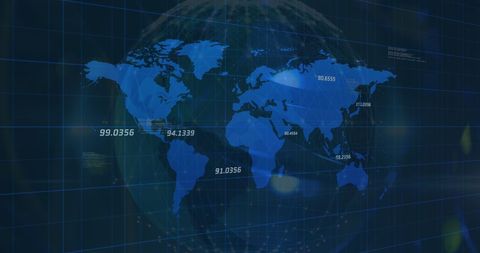
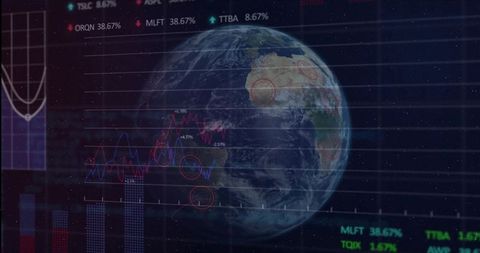
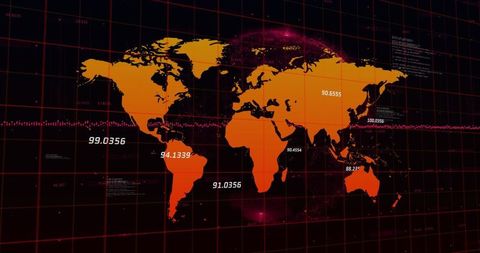
- Global Economy Data Visualization on Financial Dashboard
Global Economy Data Visualization on Financial Dashboard Image

This vibrant image showcases a globe silhouette superimposed on a cutting-edge financial dashboard. Ideal for illustrating topics related to global finance, market analytics, technology advancements in financial data processing, and investment trends. Perfect for use in financial reports, investment blogs, and economic analysis articles.
Powered by 


downloads
Tags:
More
Credit Photo
If you would like to credit the Photo, here are some ways you can do so
Text Link
photo Link
<span class="text-link">
<span>
<a target="_blank" href=https://pikwizard.com/photo/global-economy-data-visualization-on-financial-dashboard/1e2ea8fc37b2e7ae9a63fa2ed978afe5/>PikWizard</a>
</span>
</span>
<span class="image-link">
<span
style="margin: 0 0 20px 0; display: inline-block; vertical-align: middle; width: 100%;"
>
<a
target="_blank"
href="https://pikwizard.com/photo/global-economy-data-visualization-on-financial-dashboard/1e2ea8fc37b2e7ae9a63fa2ed978afe5/"
style="text-decoration: none; font-size: 10px; margin: 0;"
>
<img src="https://pikwizard.com/pw/medium/1e2ea8fc37b2e7ae9a63fa2ed978afe5.jpg" style="margin: 0; width: 100%;" alt="" />
<p style="font-size: 12px; margin: 0;">PikWizard</p>
</a>
</span>
</span>
Free (free of charge)
Free for personal and commercial use.
Author: People Creations
Similar Free Stock Images

Premium


Premium

Premium

Premium


Premium


Premium


Premium

Premium


Premium
Premium

Premium


Premium


Premium


Premium


Premium


Premium


Premium


Premium


Premium


Premium


Premium

Premium


Premium


Premium


Premium


Explore More Free Stock Images