- Home >
- Stock Photos >
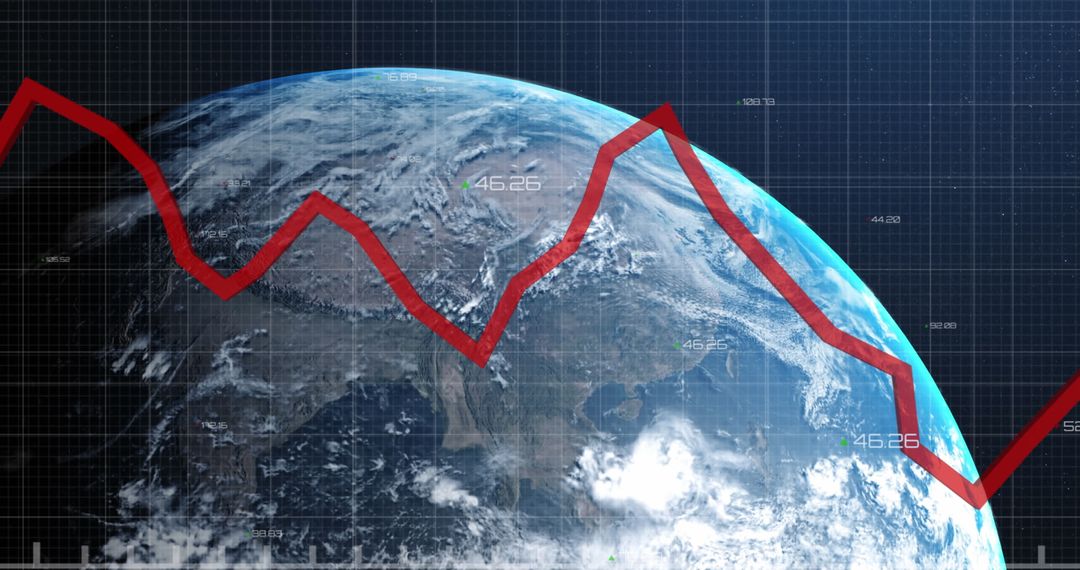
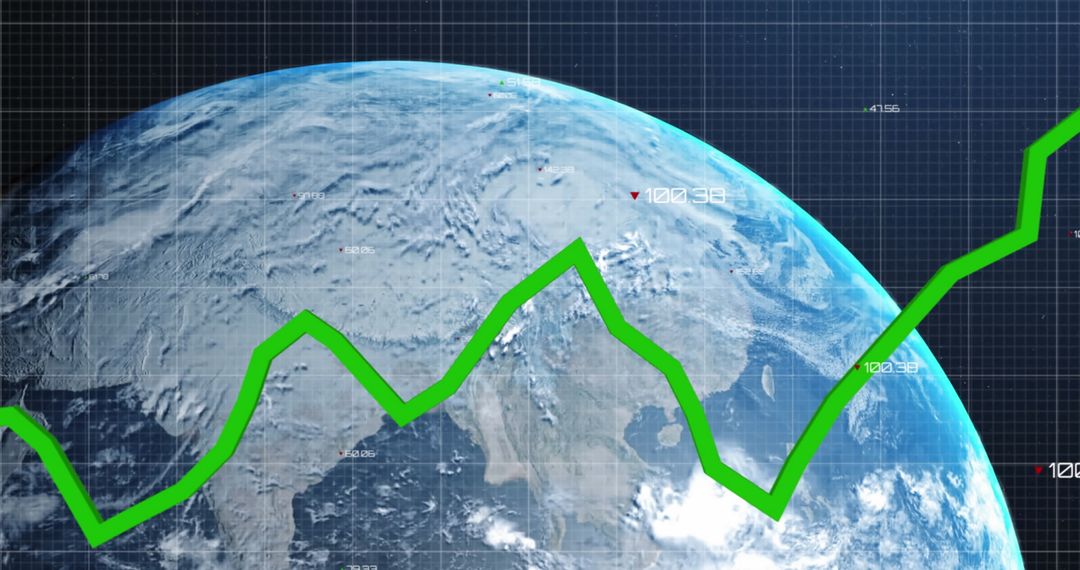
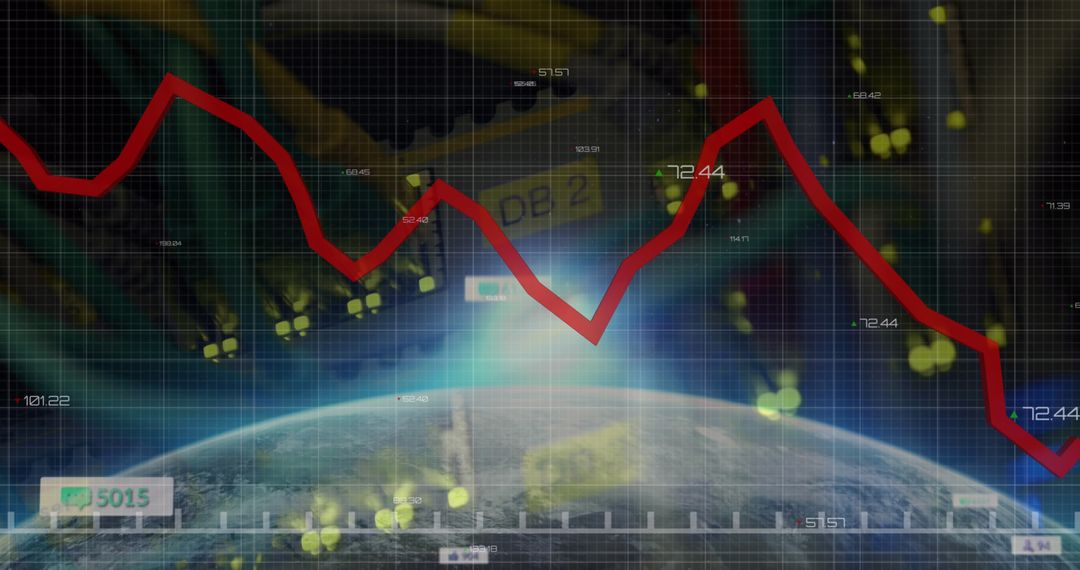
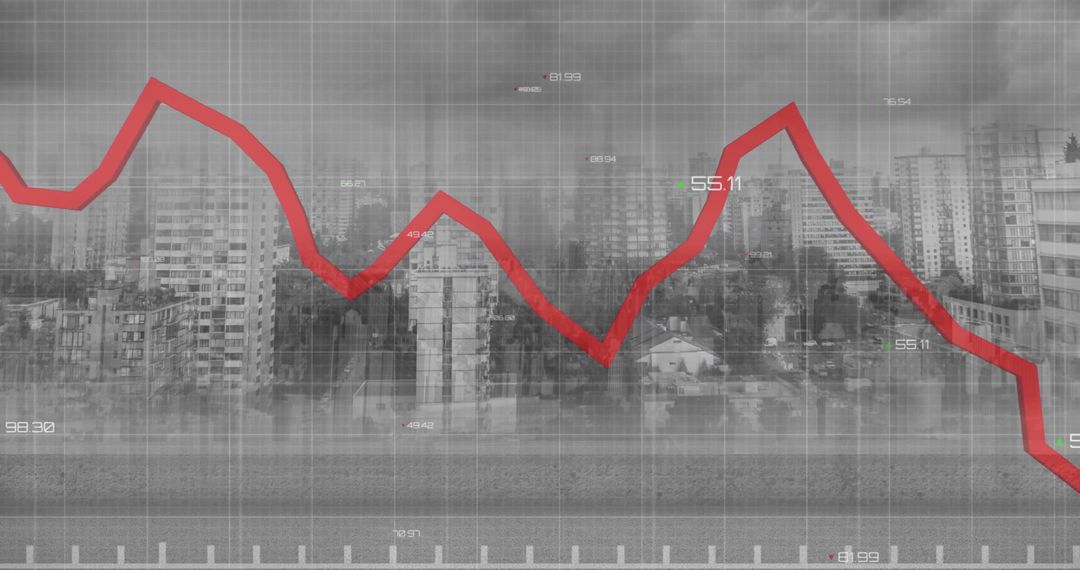
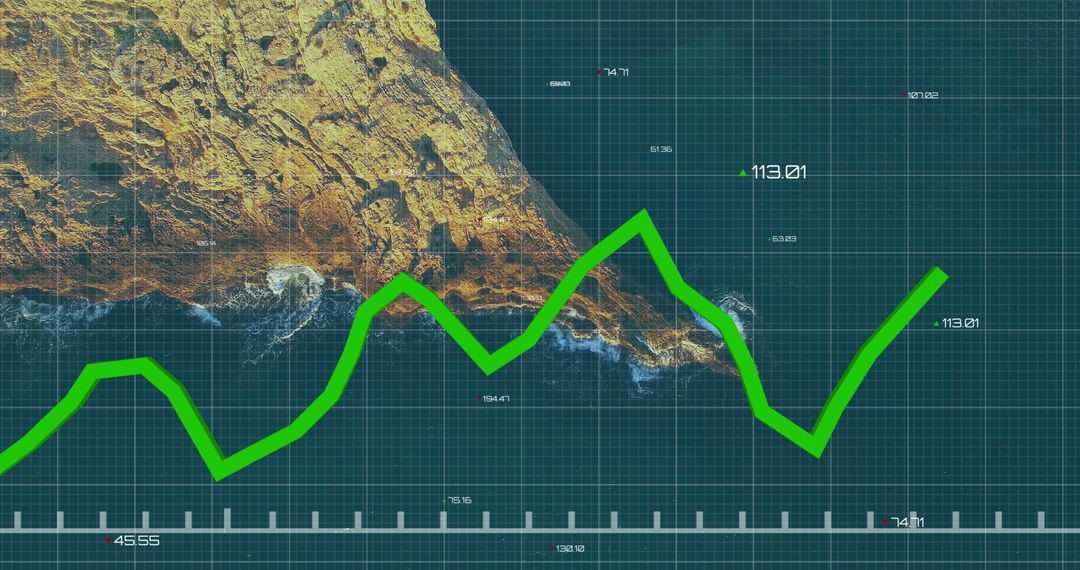
- Global Economy Decline with Red Line Indicator
Global Economy Decline with Red Line Indicator Image
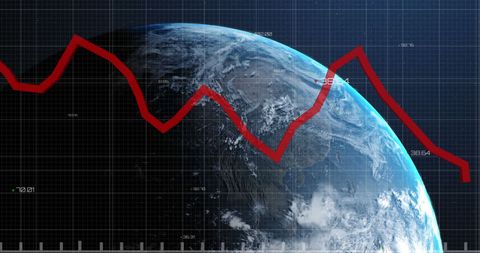
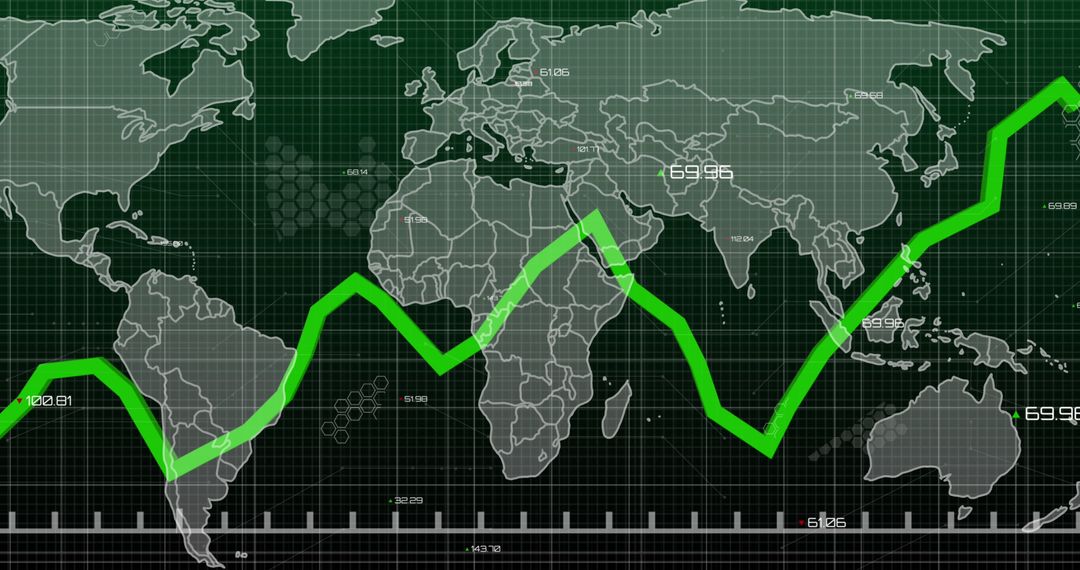
Depicting a global economic downturn with a red downward line traversing over the image of Earth, this graphic is ideally suited for content related to economic analysis, financial markets, and global business trends. It can be used in publications discussing stock market crises, economic reports, or financial forecasts. The visual representation of data overlaying a map of Earth emphasizes the international scope, making it suitable for articles, presentations, and infographics dealing with worldwide economic issues.
Powered by 


2
downloads
downloads
Tags:
More
Credit Photo
If you would like to credit the Photo, here are some ways you can do so
Text Link
photo Link
<span class="text-link">
<span>
<a target="_blank" href=https://pikwizard.com/photo/global-economy-decline-with-red-line-indicator/89c31b1088e792c13a4634c7dd4d127a/>PikWizard</a>
</span>
</span>
<span class="image-link">
<span
style="margin: 0 0 20px 0; display: inline-block; vertical-align: middle; width: 100%;"
>
<a
target="_blank"
href="https://pikwizard.com/photo/global-economy-decline-with-red-line-indicator/89c31b1088e792c13a4634c7dd4d127a/"
style="text-decoration: none; font-size: 10px; margin: 0;"
>
<img src="https://pikwizard.com/pw/medium/89c31b1088e792c13a4634c7dd4d127a.jpg" style="margin: 0; width: 100%;" alt="" />
<p style="font-size: 12px; margin: 0;">PikWizard</p>
</a>
</span>
</span>
Free (free of charge)
Free for personal and commercial use.
Author: People Creations
Similar Free Stock Images

Premium


Premium


Premium


Premium


Premium


Premium


Premium


Premium


Premium


Premium


Premium


Premium


Premium


Premium


Premium


Premium


Premium


Premium


Premium


Premium


Premium


Premium


Premium


Premium