- Home >
- Stock Photos >
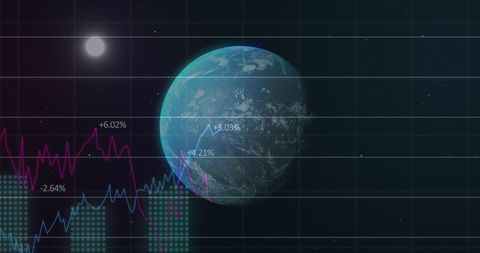
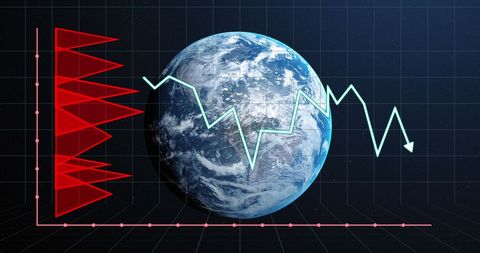
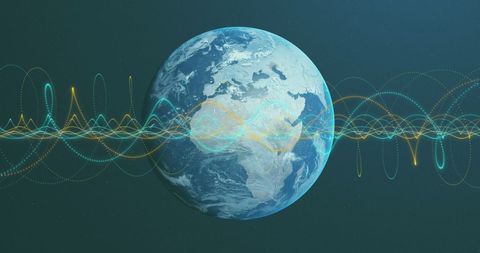
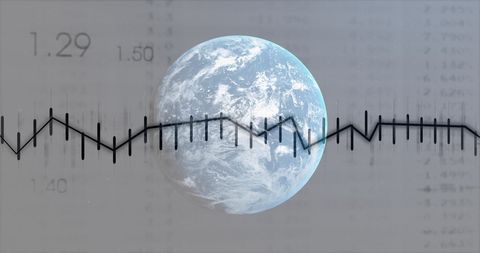
- Global Economy Downtrend Concept with Earth and Declining Graph
Global Economy Downtrend Concept with Earth and Declining Graph Image
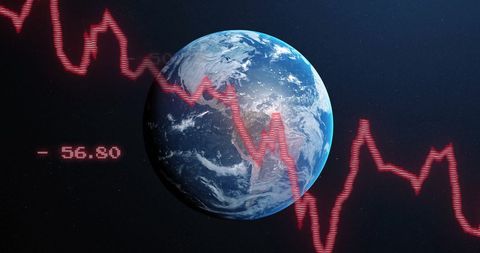
Image depicts Earth with a digitally generated declining stock market graph superimposed, evoking themes of economic challenges and global financial instability. Use in contexts involving international finance issues, economic analysis, market studies, or data-driven projects.
Powered by 


2
downloads
downloads
Tags:
More
Credit Photo
If you would like to credit the Photo, here are some ways you can do so
Text Link
photo Link
<span class="text-link">
<span>
<a target="_blank" href=https://pikwizard.com/photo/global-economy-downtrend-concept-with-earth-and-declining-graph/0a2324eb4646fee499cfaf9c499b1929/>PikWizard</a>
</span>
</span>
<span class="image-link">
<span
style="margin: 0 0 20px 0; display: inline-block; vertical-align: middle; width: 100%;"
>
<a
target="_blank"
href="https://pikwizard.com/photo/global-economy-downtrend-concept-with-earth-and-declining-graph/0a2324eb4646fee499cfaf9c499b1929/"
style="text-decoration: none; font-size: 10px; margin: 0;"
>
<img src="https://pikwizard.com/pw/medium/0a2324eb4646fee499cfaf9c499b1929.jpg" style="margin: 0; width: 100%;" alt="" />
<p style="font-size: 12px; margin: 0;">PikWizard</p>
</a>
</span>
</span>
Free (free of charge)
Free for personal and commercial use.
Author: People Creations
Similar Free Stock Images
Loading...

Premium


Premium


Premium


Premium


Premium

Premium

Premium

Premium


Premium

Premium

Premium

Premium


Premium


Premium


Premium


Premium

Premium


Premium

Premium


Premium


Premium


Premium


Premium


Premium


Premium