- Home >
- Stock Photos >
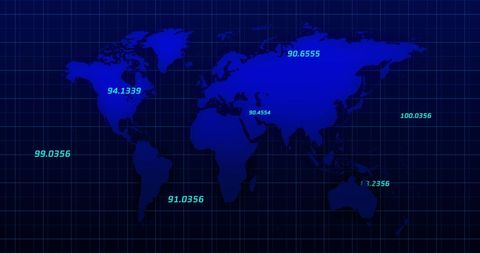
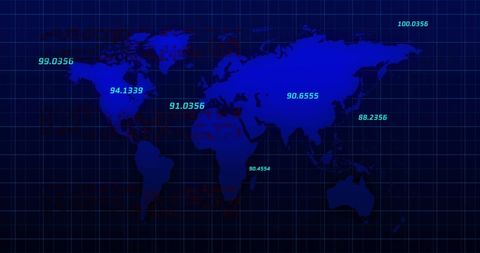
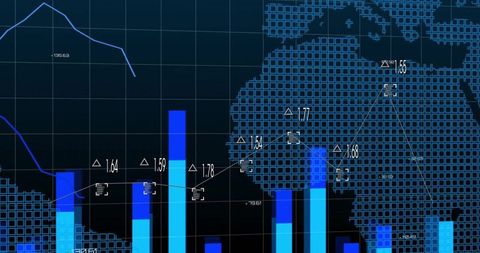
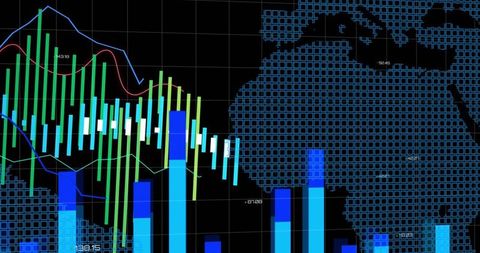
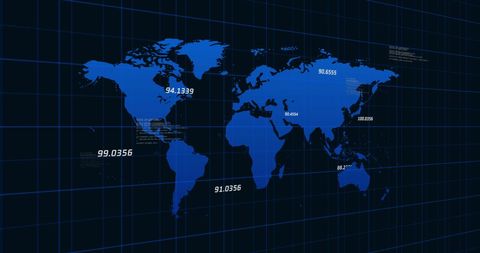
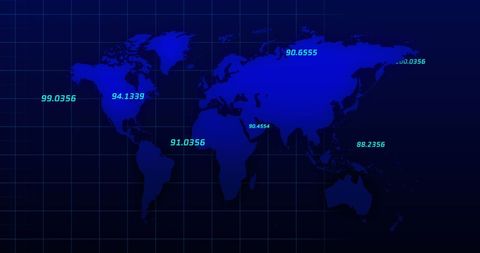
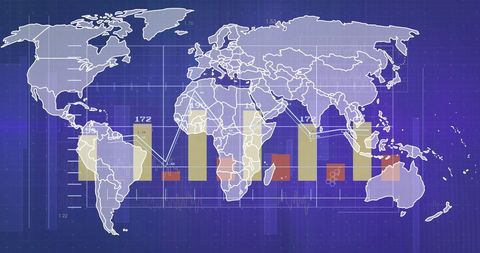
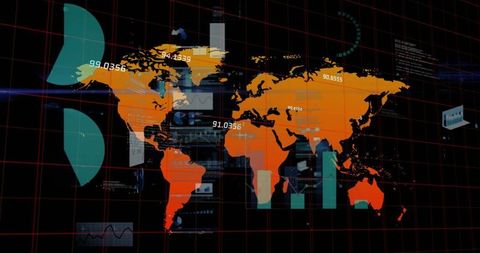
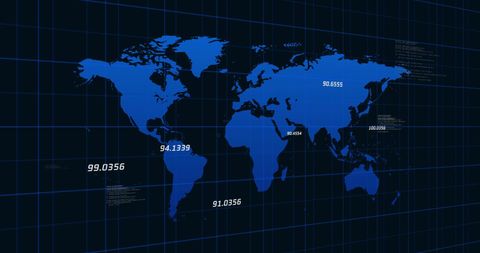
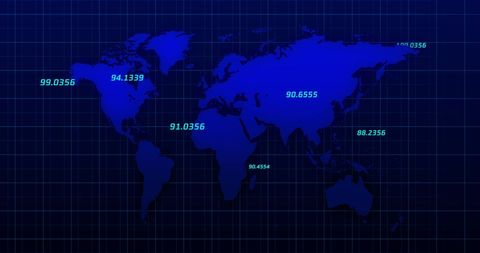
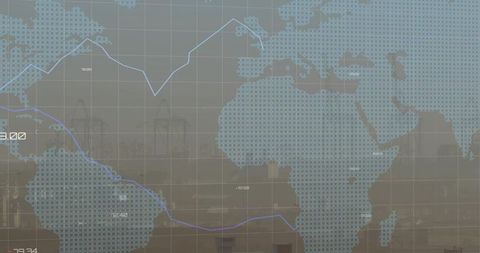
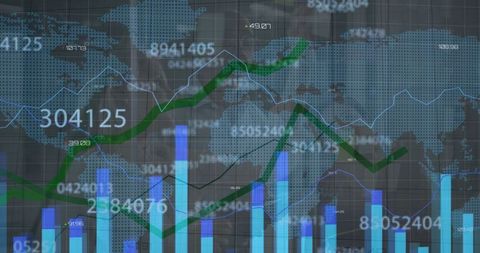
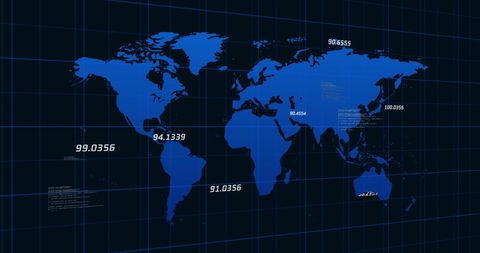
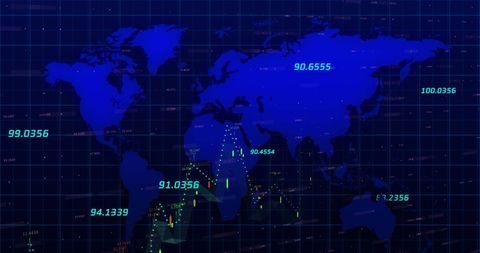
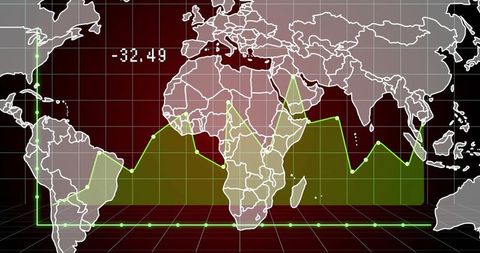
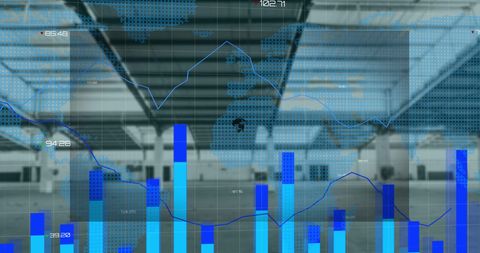
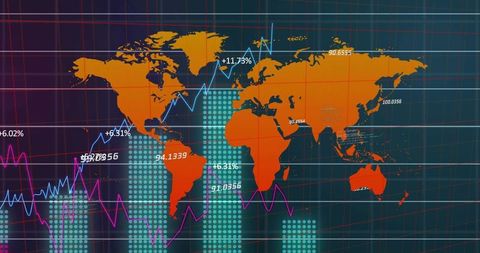
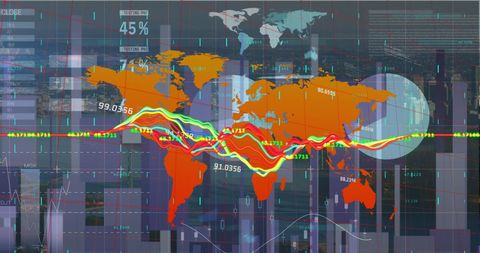
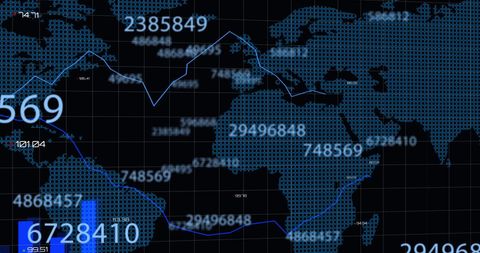
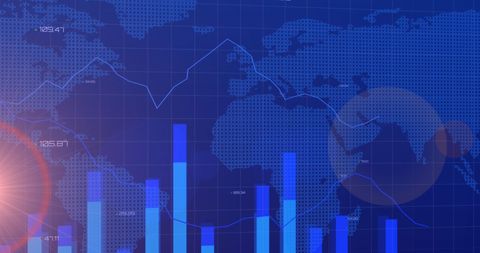
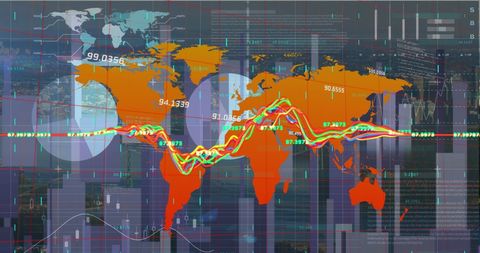
- Global Economy Trends with Digital Graph Visualization
Global Economy Trends with Digital Graph Visualization Image

Depicts financial data and global economic trends on a digital display with line charts and bar graphs over a world map grid. Ideal for illustrating economic reports, business presentations, and articles related to finance and global markets.

downloads
Tags:
More
Credit Photo
If you would like to credit the Photo, here are some ways you can do so
Text Link
photo Link
<span class="text-link">
<span>
<a target="_blank" href=https://pikwizard.com/photo/global-economy-trends-with-digital-graph-visualization/69bf76b04b3a855650974e2150eeecaa/>PikWizard</a>
</span>
</span>
<span class="image-link">
<span
style="margin: 0 0 20px 0; display: inline-block; vertical-align: middle; width: 100%;"
>
<a
target="_blank"
href="https://pikwizard.com/photo/global-economy-trends-with-digital-graph-visualization/69bf76b04b3a855650974e2150eeecaa/"
style="text-decoration: none; font-size: 10px; margin: 0;"
>
<img src="https://pikwizard.com/pw/medium/69bf76b04b3a855650974e2150eeecaa.jpg" style="margin: 0; width: 100%;" alt="" />
<p style="font-size: 12px; margin: 0;">PikWizard</p>
</a>
</span>
</span>
Free (free of charge)
Free for personal and commercial use.
Author: Authentic Images