
- Home >
- Stock Photos >
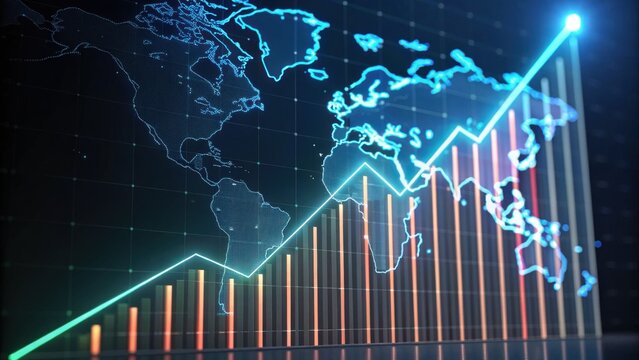
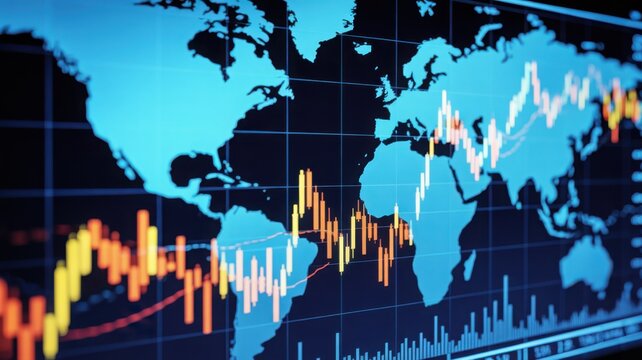
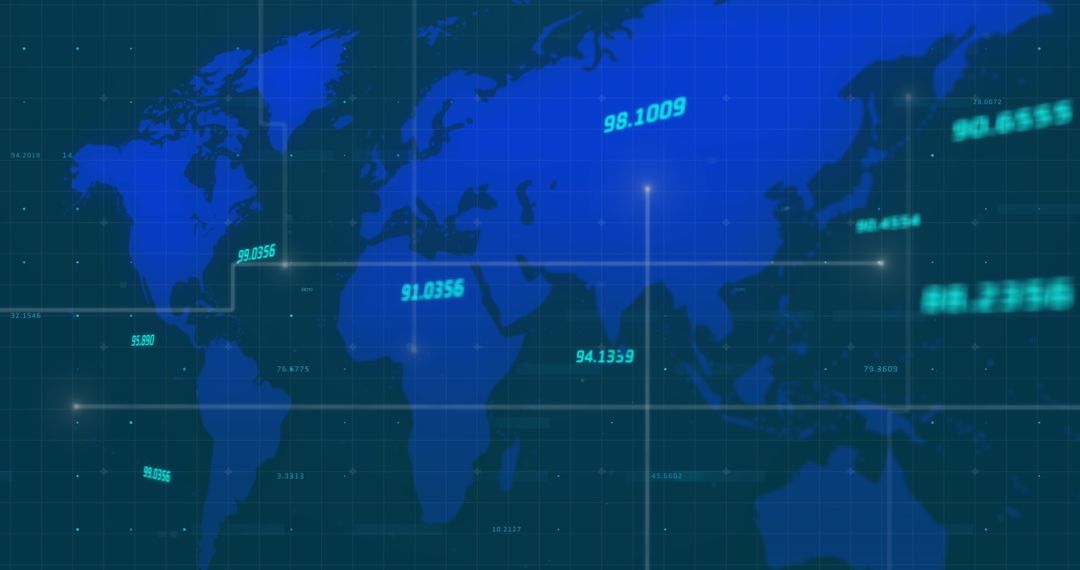
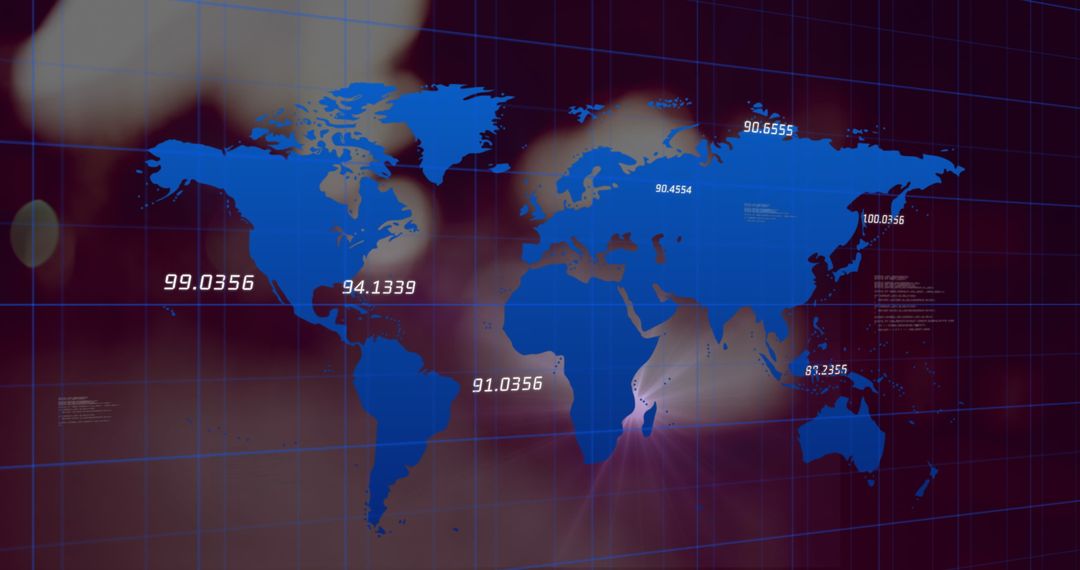
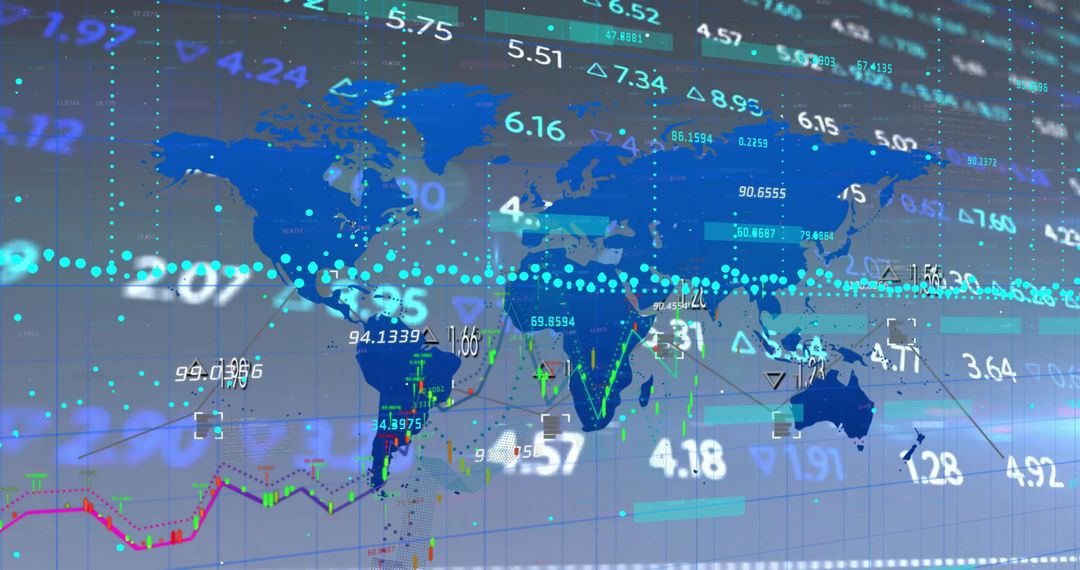
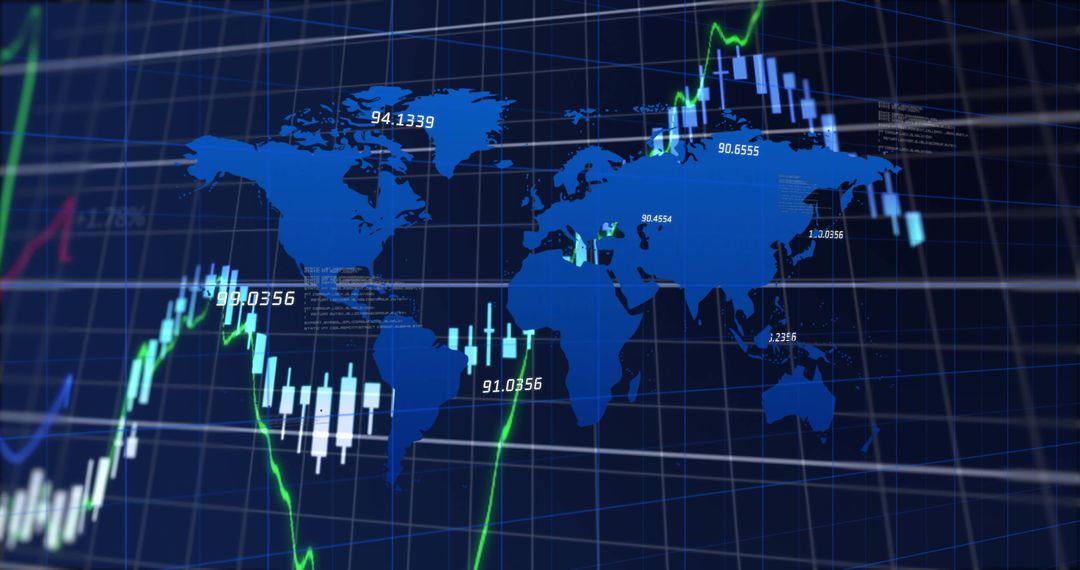
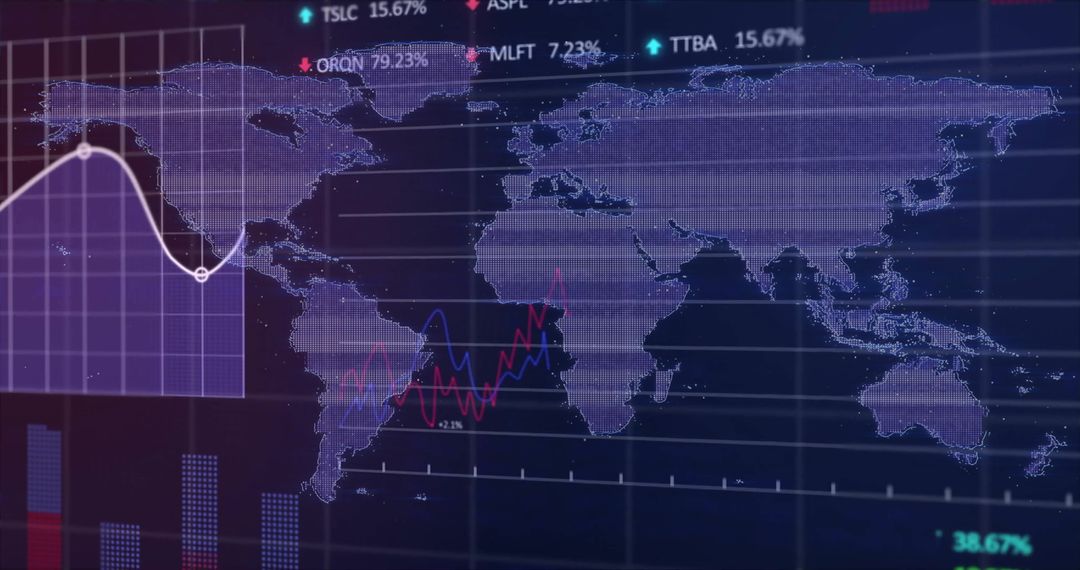
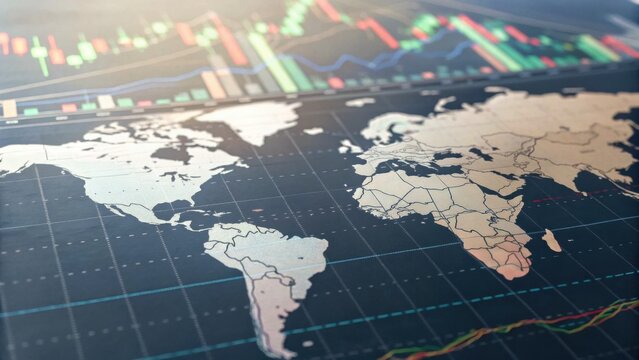
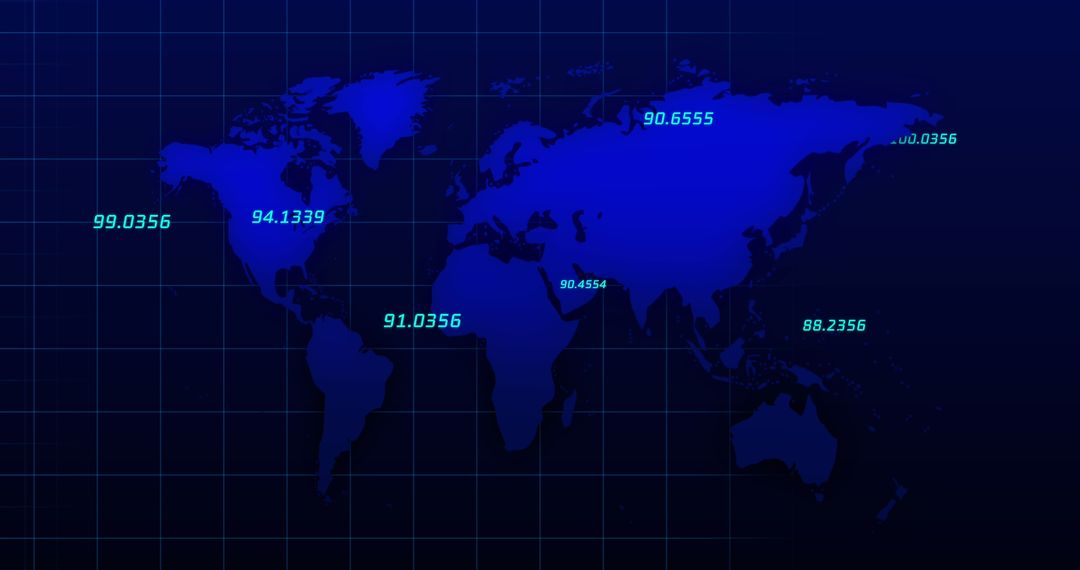
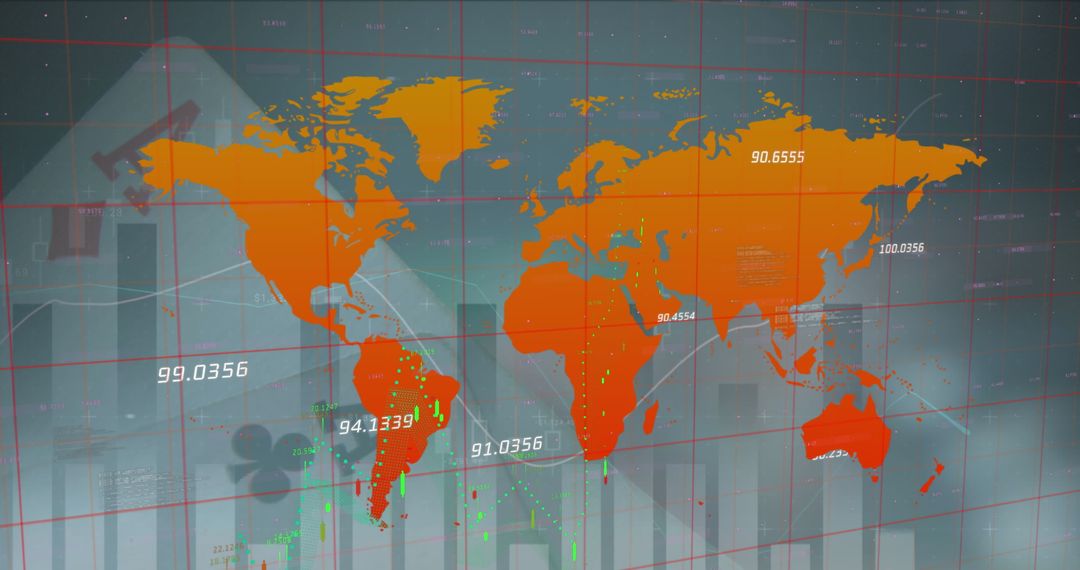
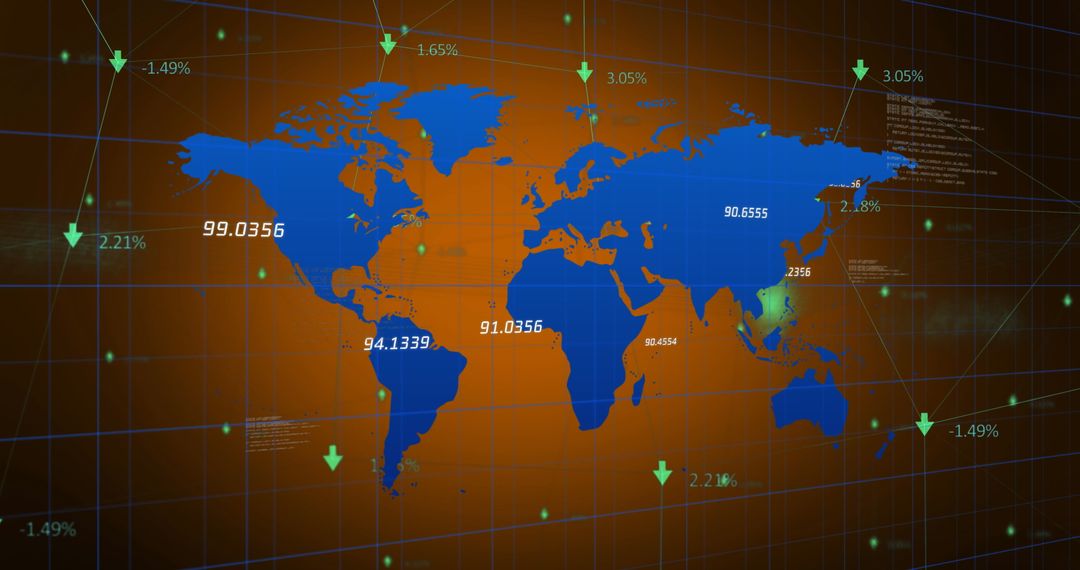
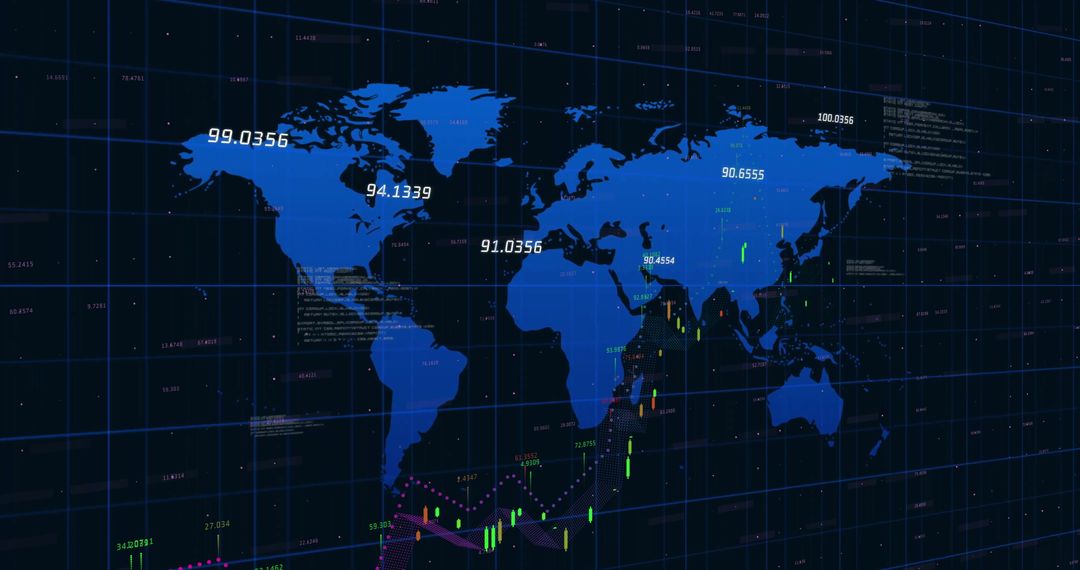
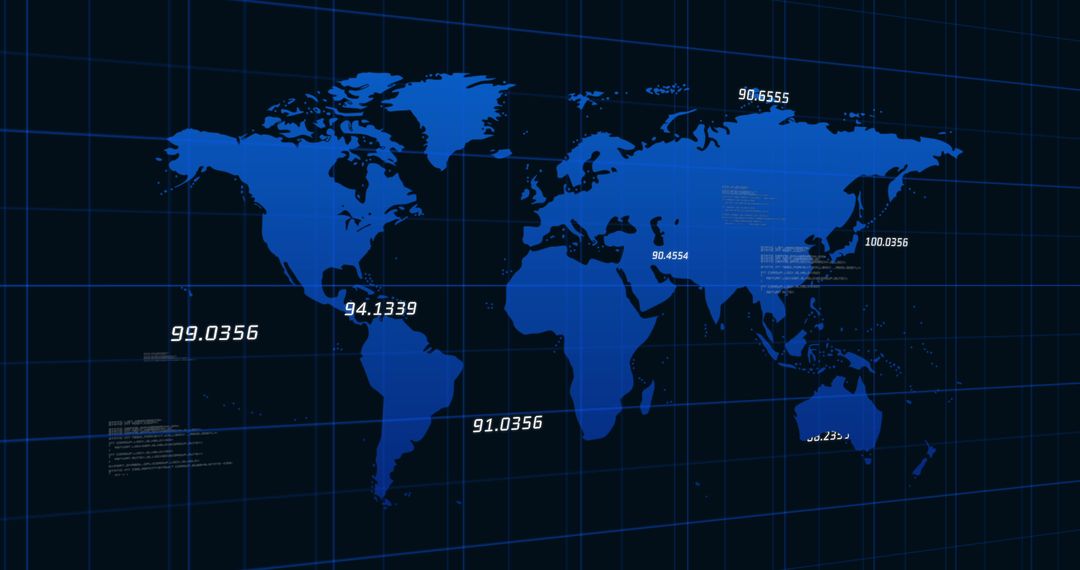
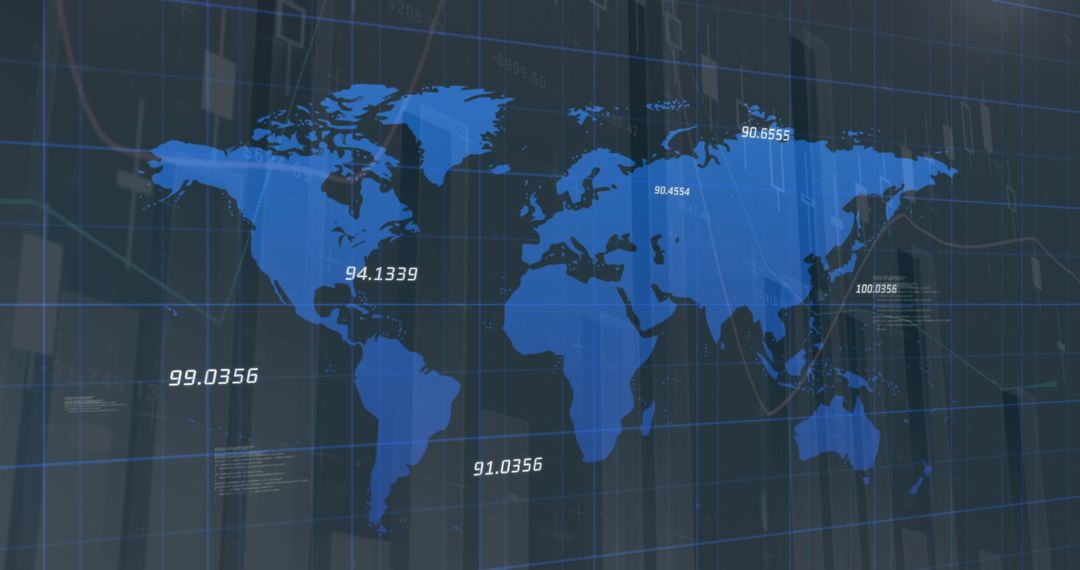
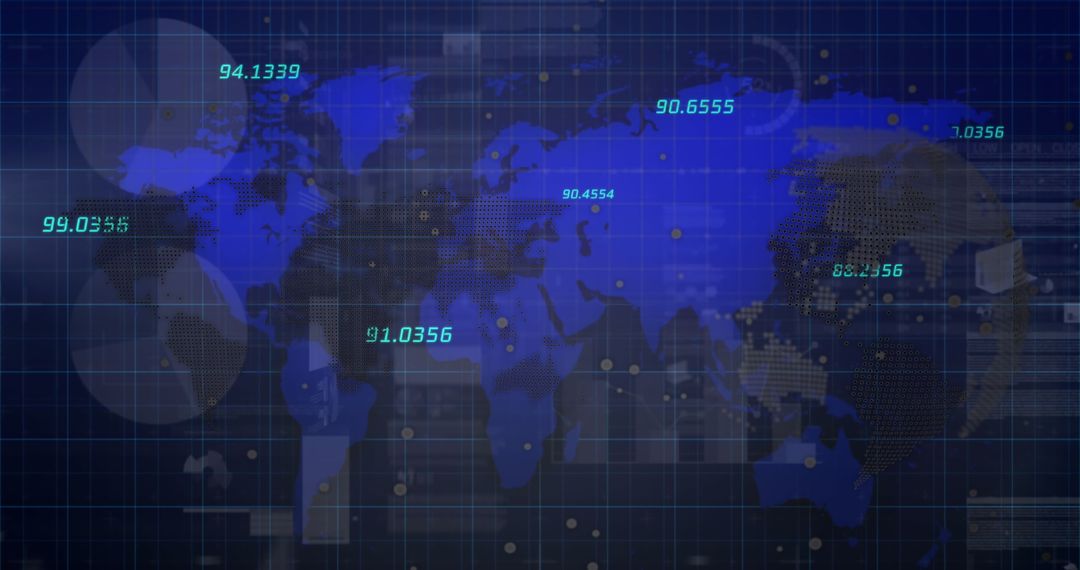
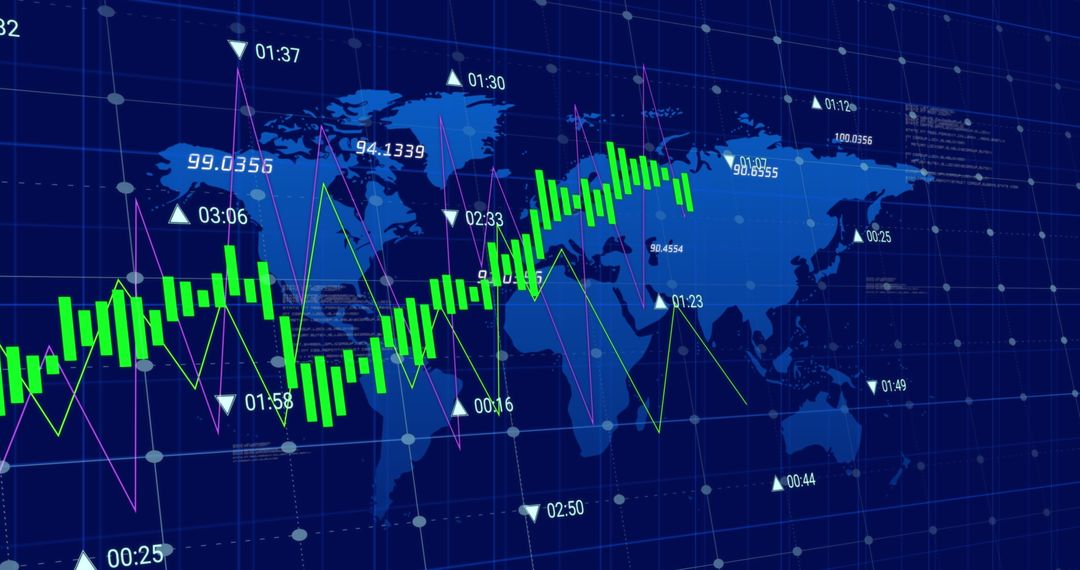
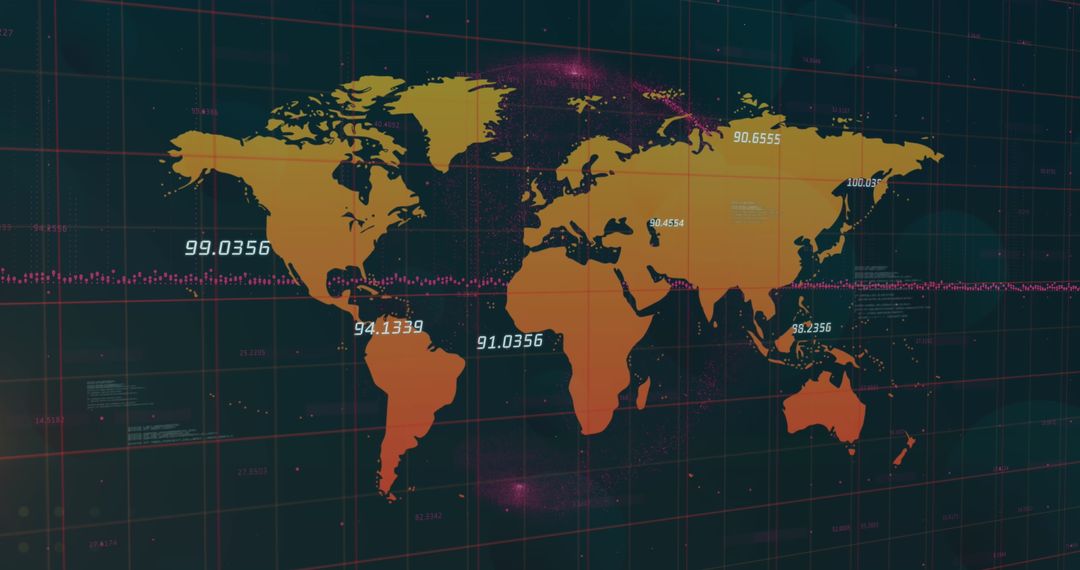
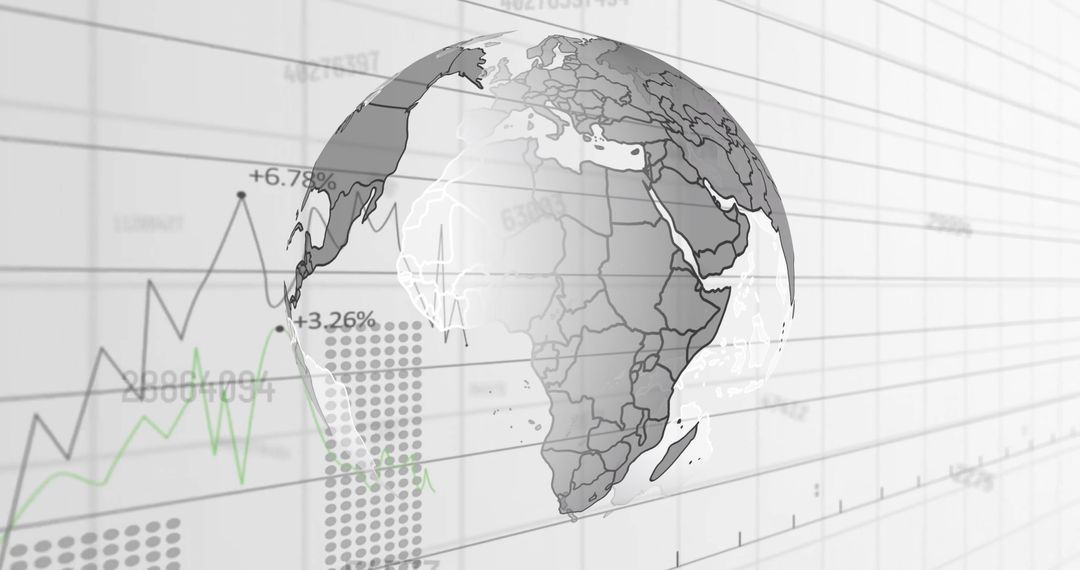
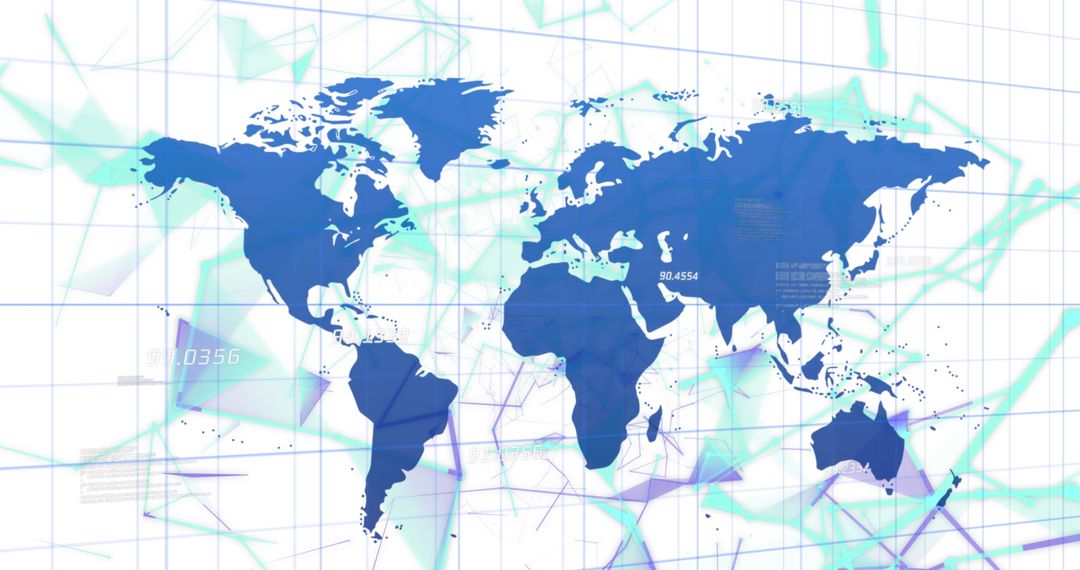
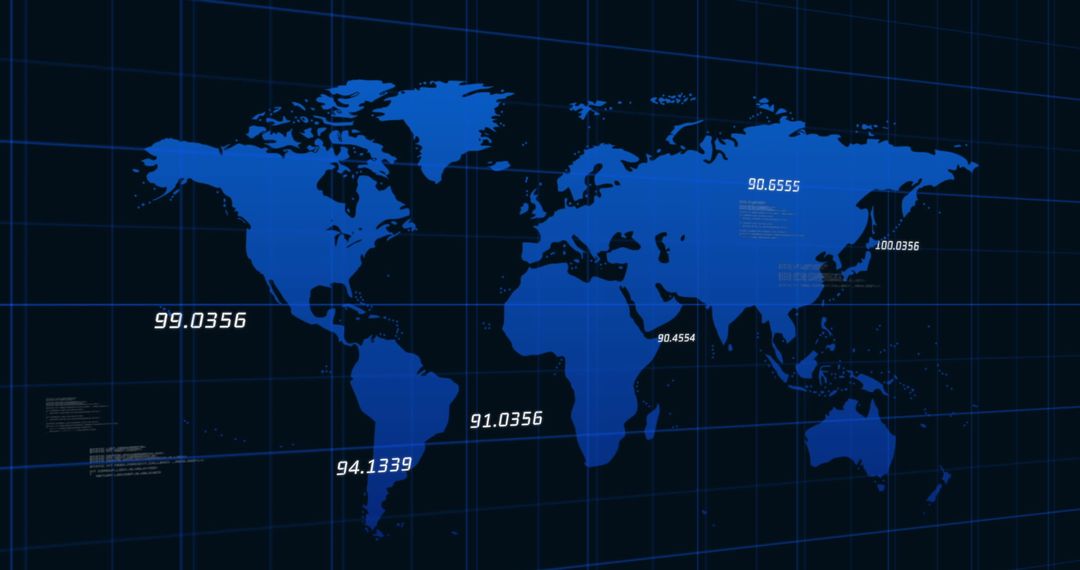
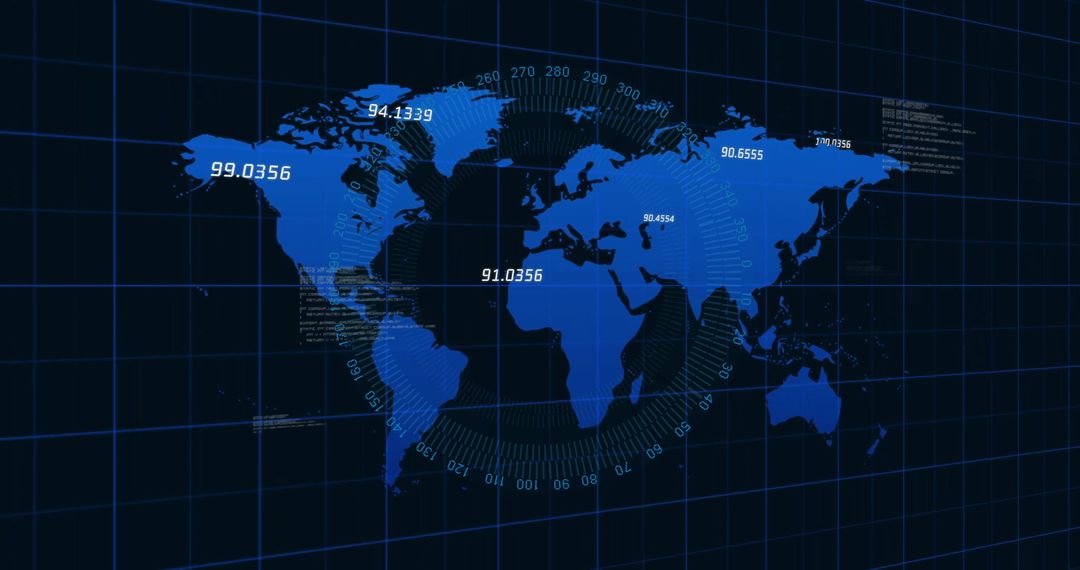
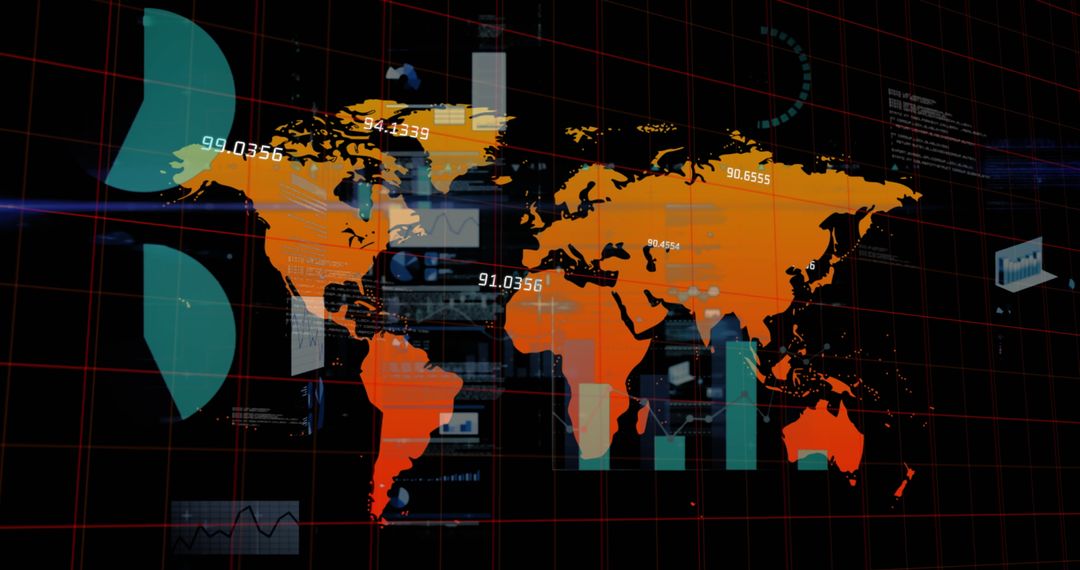
- Global Economy Visualization with Graphs and Financial Data
Global Economy Visualization with Graphs and Financial Data Image

World map illustrating global financial data and economic trends overlaid with investment charts. Useful for presentations on global economy, market analysis, and financial reports. Ideal for articles, business meetings, and educational materials emphasizing international finance topics.
Powered by 


0
downloads
downloads
Tags:
More
Credit Photo
If you would like to credit the Photo, here are some ways you can do so
Text Link
photo Link
<span class="text-link">
<span>
<a target="_blank" href=https://pikwizard.com/photo/global-economy-visualization-with-graphs-and-financial-data/66b922cd2d9906e5b88d7f90ee4b5d7c/>PikWizard</a>
</span>
</span>
<span class="image-link">
<span
style="margin: 0 0 20px 0; display: inline-block; vertical-align: middle; width: 100%;"
>
<a
target="_blank"
href="https://pikwizard.com/photo/global-economy-visualization-with-graphs-and-financial-data/66b922cd2d9906e5b88d7f90ee4b5d7c/"
style="text-decoration: none; font-size: 10px; margin: 0;"
>
<img src="https://pikwizard.com/pw/medium/66b922cd2d9906e5b88d7f90ee4b5d7c.jpg" style="margin: 0; width: 100%;" alt="" />
<p style="font-size: 12px; margin: 0;">PikWizard</p>
</a>
</span>
</span>
Free (free of charge)
Free for personal and commercial use.
Author: People Creations
Similar Free Stock Images

Premium


Premium


Premium


Premium


Premium


Premium


Premium


Premium


Premium


Premium


Premium


Premium


Premium


Premium


Premium


Premium


Premium


Premium


Premium


Premium


Premium


Premium


Premium


Premium

