- Home >
- Stock Photos >
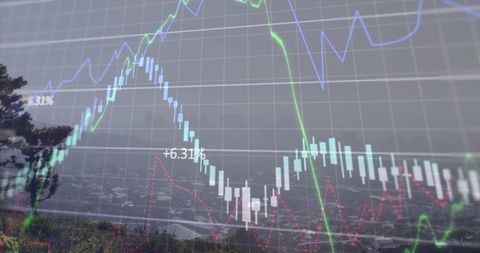
- Global Economy with Stock Data and Renewable Energy Theme
Global Economy with Stock Data and Renewable Energy Theme Image

This visual combines elements of stock market data analytics and renewable energy, featuring a solar panel against a backdrop of statistical charts and cloudy skies. It symbolizes the intersection of sustainable technology and financial markets, ideal for illustrating articles or presentations on economic forecasts, investment in renewable energies, or technology advancement in business strategies. Useful for websites and publications focused on finance, business, or environmental topics.
Powered by 


2
downloads
downloads
Tags:
More
Credit Photo
If you would like to credit the Photo, here are some ways you can do so
Text Link
photo Link
<span class="text-link">
<span>
<a target="_blank" href=https://pikwizard.com/photo/global-economy-with-stock-data-and-renewable-energy-theme/9963c8a27e445e3f82288d740d7b7791/>PikWizard</a>
</span>
</span>
<span class="image-link">
<span
style="margin: 0 0 20px 0; display: inline-block; vertical-align: middle; width: 100%;"
>
<a
target="_blank"
href="https://pikwizard.com/photo/global-economy-with-stock-data-and-renewable-energy-theme/9963c8a27e445e3f82288d740d7b7791/"
style="text-decoration: none; font-size: 10px; margin: 0;"
>
<img src="https://pikwizard.com/pw/medium/9963c8a27e445e3f82288d740d7b7791.jpg" style="margin: 0; width: 100%;" alt="" />
<p style="font-size: 12px; margin: 0;">PikWizard</p>
</a>
</span>
</span>
Free (free of charge)
Free for personal and commercial use.
Author: Awesome Content
Similar Free Stock Images
Loading...

Premium


Premium

Premium


Premium


Premium


Premium

Premium


Premium

Premium


Premium

Premium

Premium


Premium


Premium


Premium


Premium


Premium


Premium

Premium


Premium


Premium


Premium


Premium


Premium


Premium