- Home >
- Stock Photos >
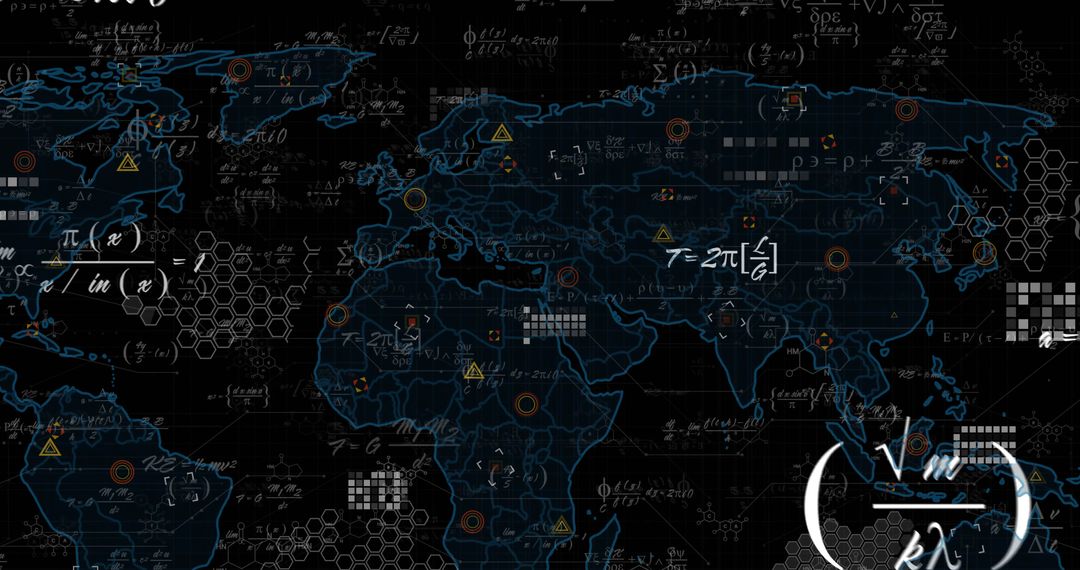
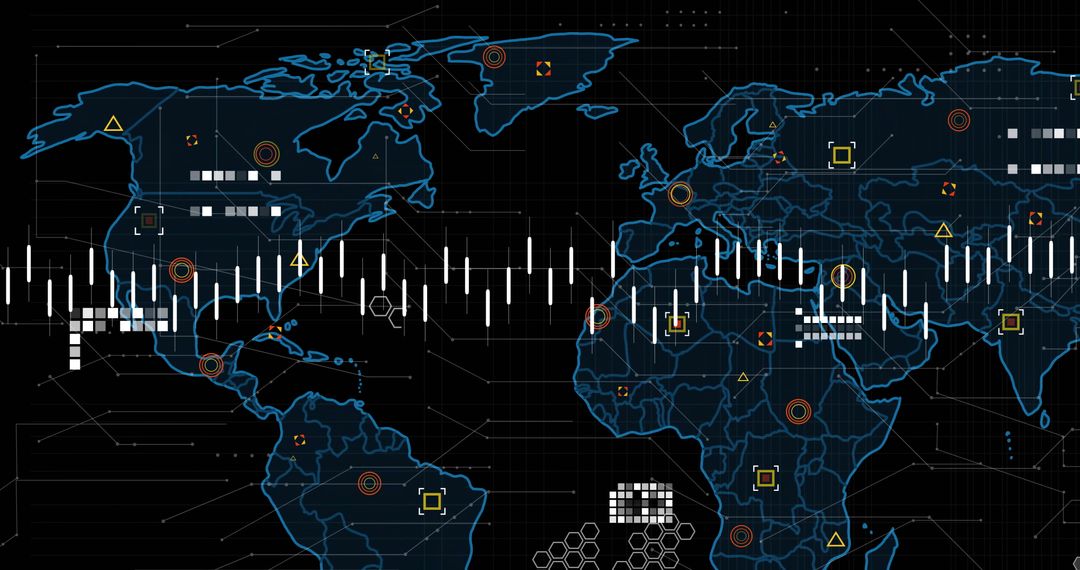
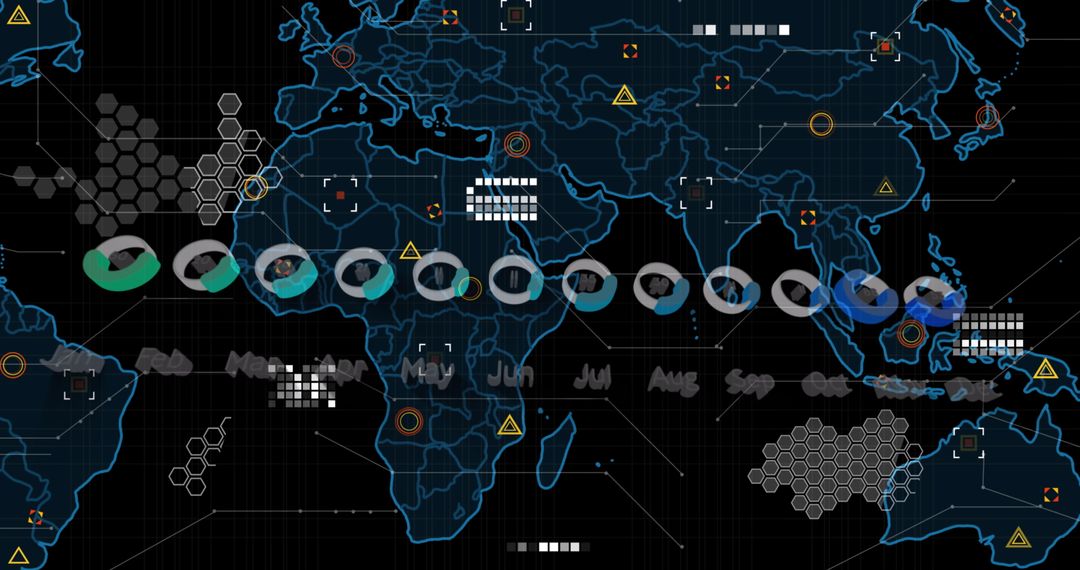
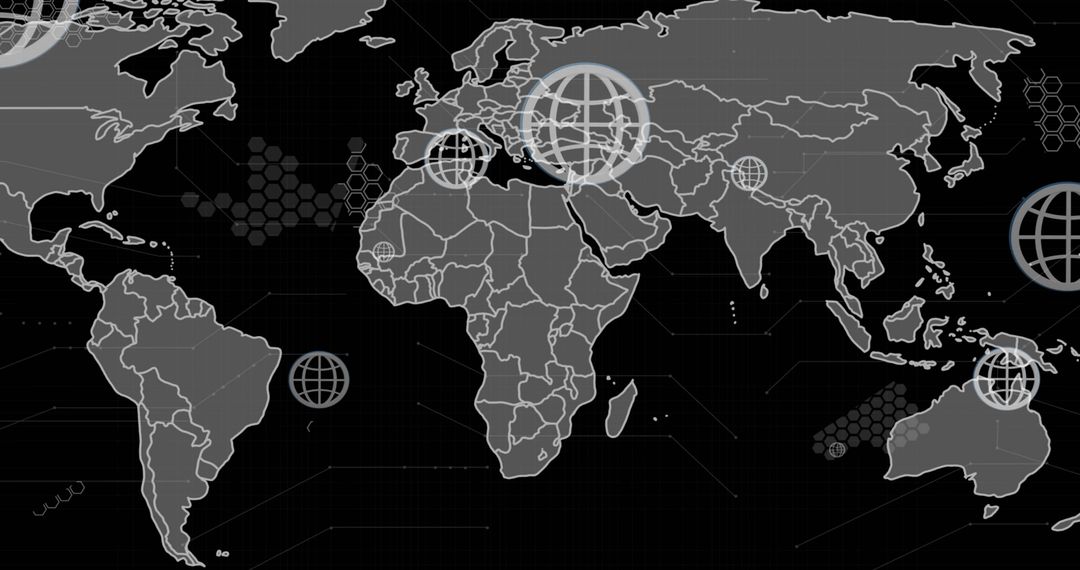
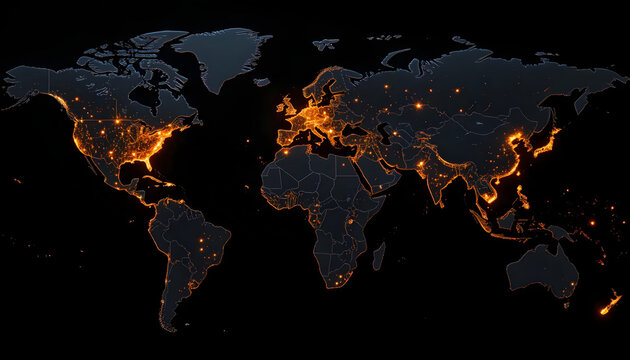
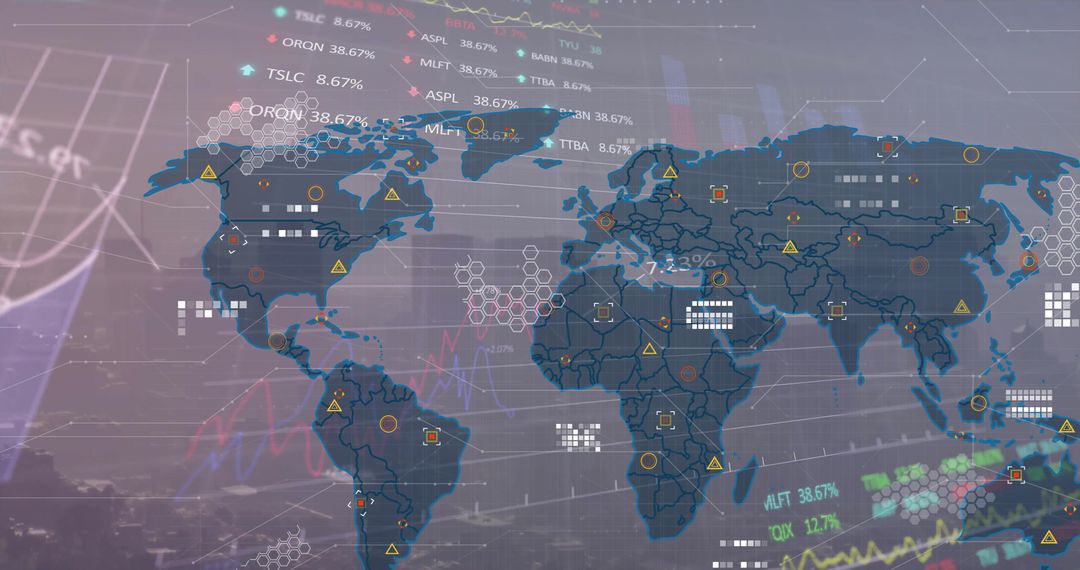
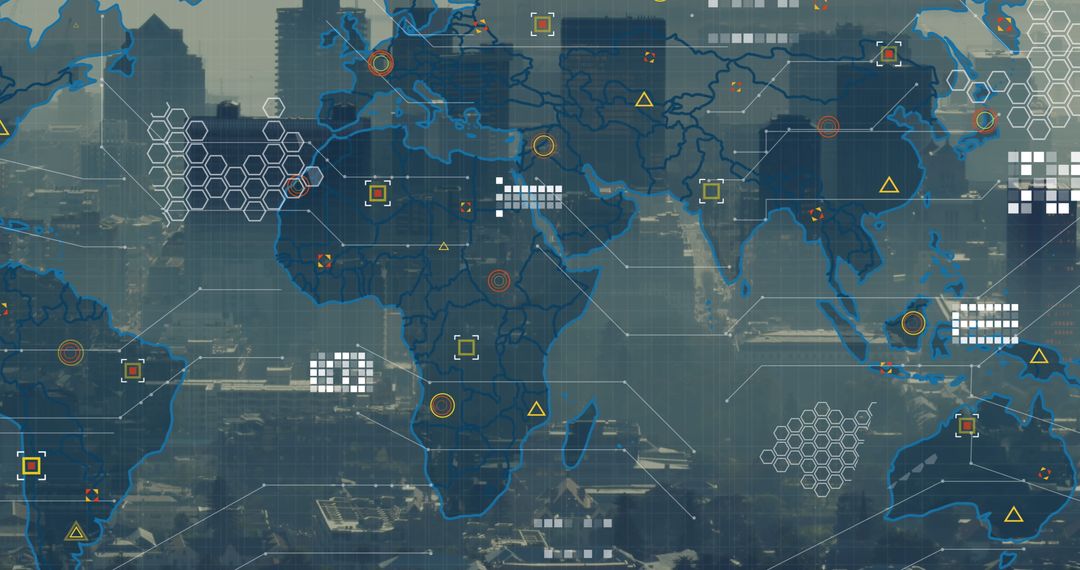
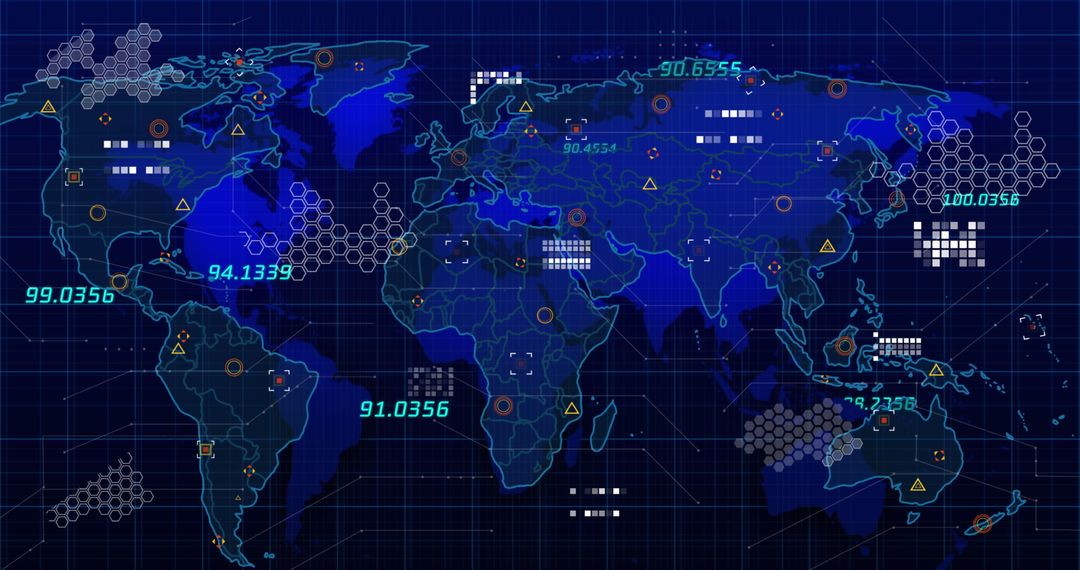
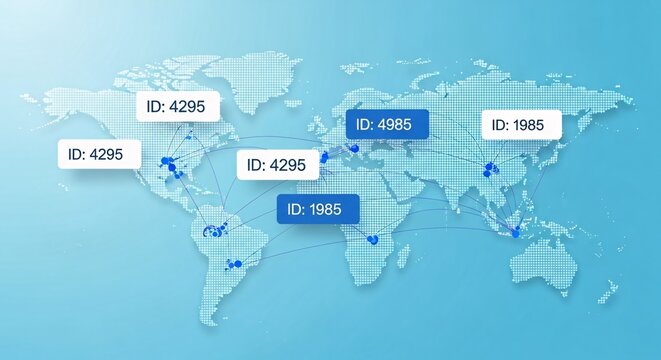
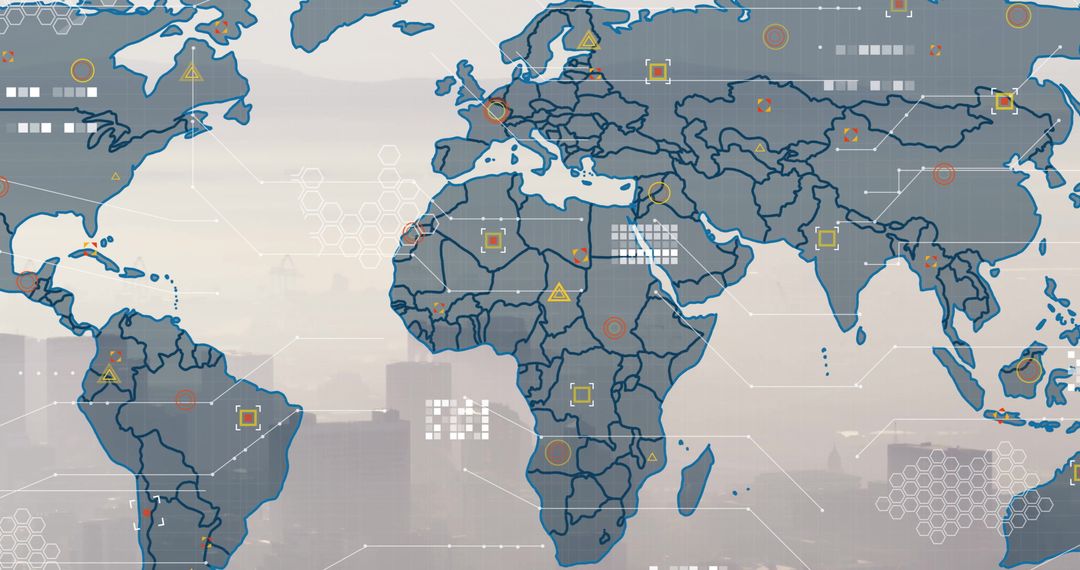
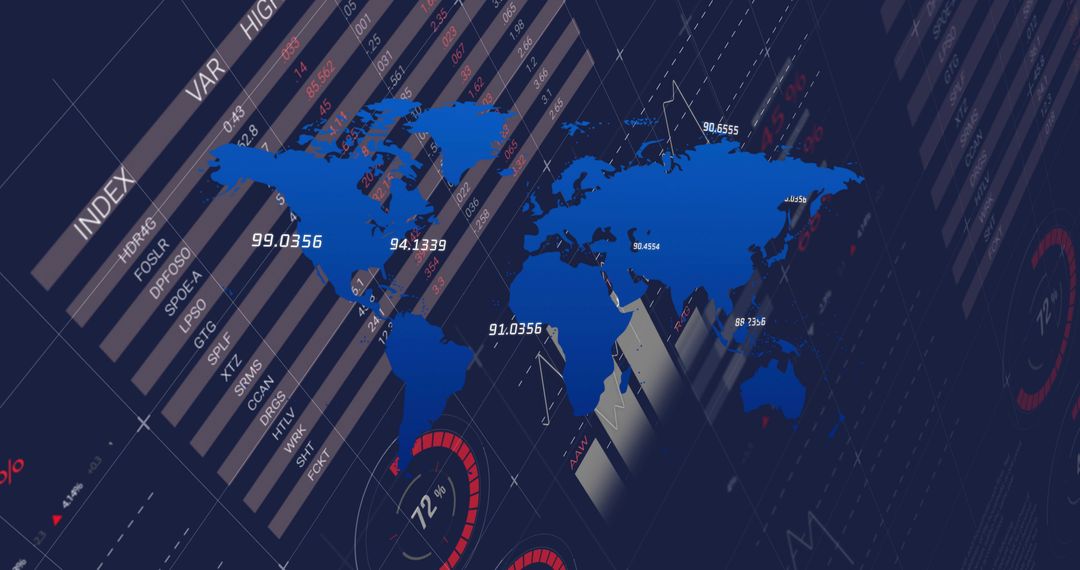
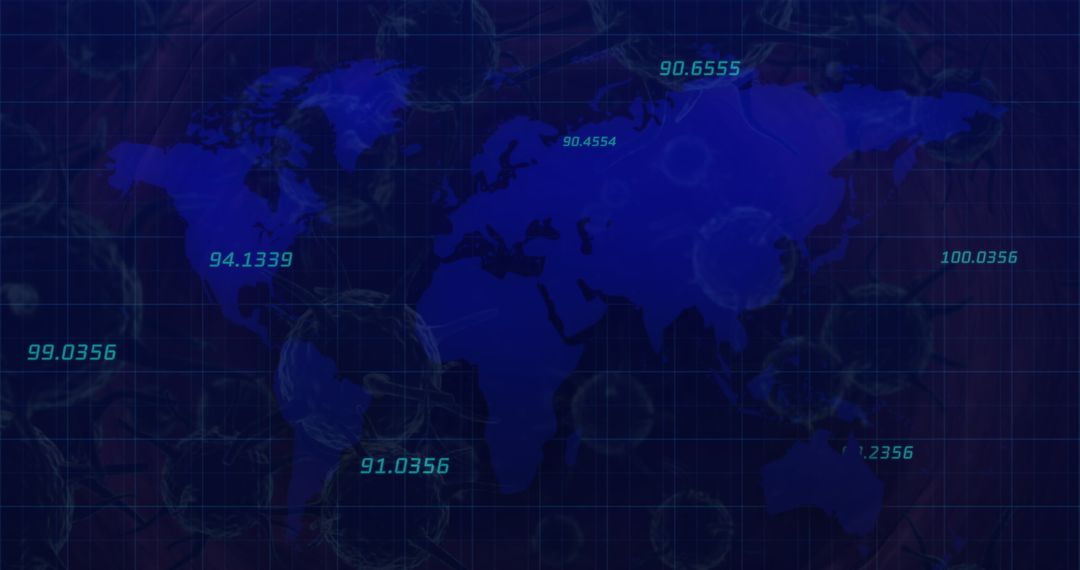
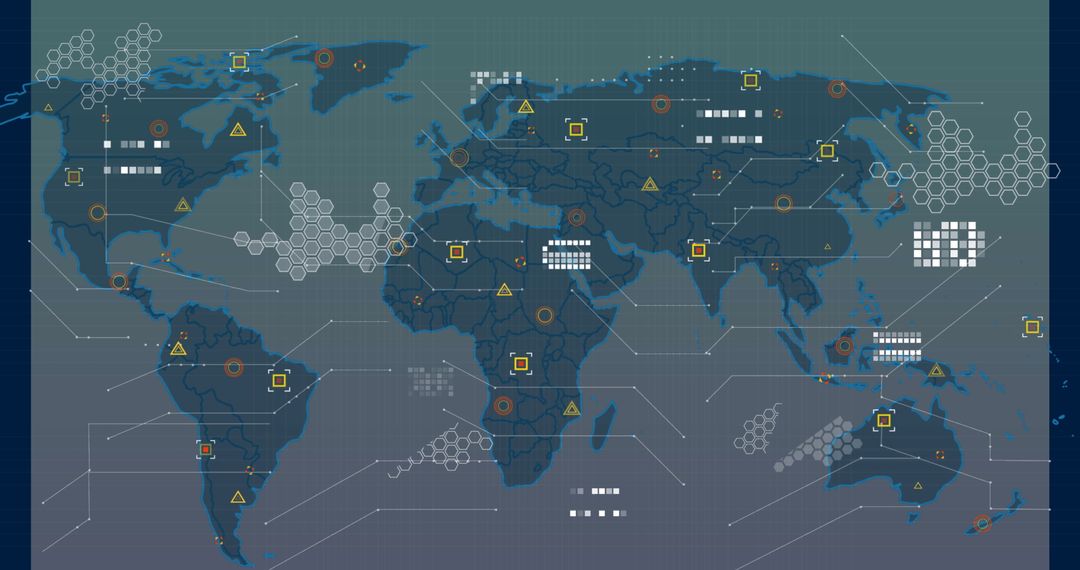
- Global energy and environmental analytics dashboard visualizing geospatial metrics
Global energy and environmental analytics dashboard visualizing geospatial metrics Image
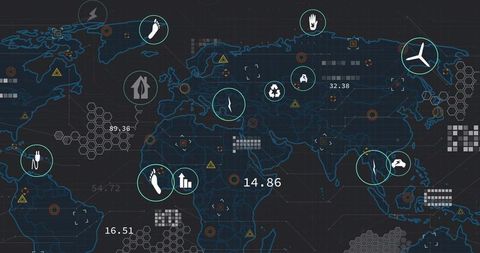
Showing global energy and environmental metrics on dark grid world map with circular data markers, icon overlays, numeric readouts and hexagonal elements. Targeting clean, modern tech and sustainability themes, useful for illustrating renewable energy distribution, carbon footprint tracking, grid performance and IoT telemetry. Working with presentations, annual reports, investor pitch decks, website headers, dashboards, marketing materials and social media posts. Customizing colors and overlays for brand alignment, adding interactive hotspots for data drilldown, pairing with charts and tables for executive summaries. Serving editorial stories about clean energy, smart grid, supply chain footprint, climate analytics and global market trends.
Powered by 


0
downloads
downloads
Tags:
More
Credit Photo
If you would like to credit the Photo, here are some ways you can do so
Text Link
photo Link
<span class="text-link">
<span>
<a target="_blank" href=https://pikwizard.com/photo/global-energy-and-environmental-analytics-dashboard-visualizing-geospatial-metrics/e0b8572d905c579c90386173a89b3032/>PikWizard</a>
</span>
</span>
<span class="image-link">
<span
style="margin: 0 0 20px 0; display: inline-block; vertical-align: middle; width: 100%;"
>
<a
target="_blank"
href="https://pikwizard.com/photo/global-energy-and-environmental-analytics-dashboard-visualizing-geospatial-metrics/e0b8572d905c579c90386173a89b3032/"
style="text-decoration: none; font-size: 10px; margin: 0;"
>
<img src="https://pikwizard.com/pw/medium/e0b8572d905c579c90386173a89b3032.jpg" style="margin: 0; width: 100%;" alt="" />
<p style="font-size: 12px; margin: 0;">PikWizard</p>
</a>
</span>
</span>
Free (free of charge)
Free for personal and commercial use.
Author: People Creations
Similar Free Stock Images

Premium


Premium


Premium


Premium


Premium


Premium


Premium


Premium


Premium


Premium


Premium


Premium


Premium


Premium


Premium

Premium


Premium


Premium


Premium


Premium


Premium


Premium


Premium


Premium