
- Home >
- Stock Photos >
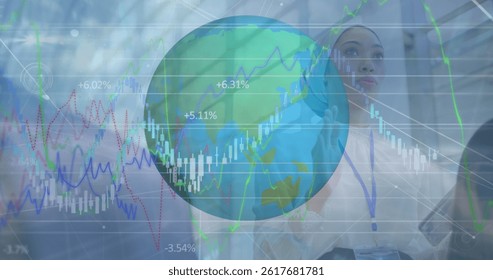
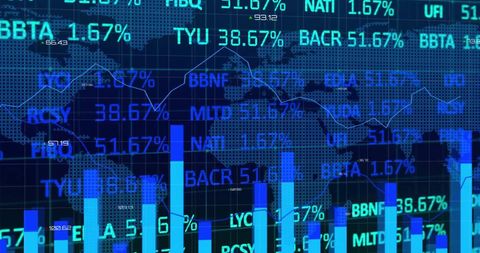
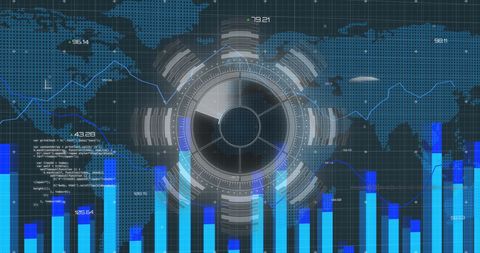
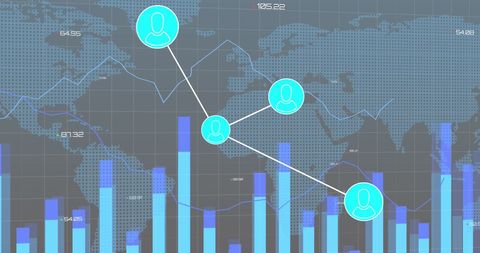
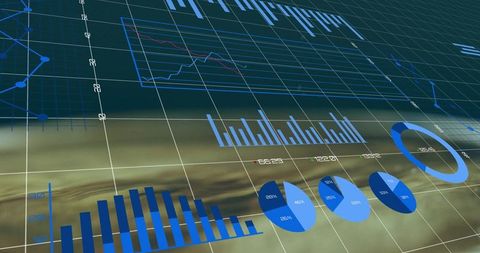
- Global Finance Analytics with Data Visualization Elements
Global Finance Analytics with Data Visualization Elements Image

Depicting digital financial data processing overlaid on a world map, this meticulously designed concept emphasizes global business analytics. Featuring a bar chart along with a radar scan, the image reflects elements of high-tech tracking and economic trend visualization connected with international markets. Suitable for illustrating modern economic developments, global finance topics, or showcasing financial services in digital marketing materials.
Powered by  - Get 15% off with code: PIKWIZARD15


downloads
Tags:
More
Credit Photo
If you would like to credit the Photo, here are some ways you can do so
Text Link
photo Link
<span class="text-link">
<span>
<a target="_blank" href=https://pikwizard.com/photo/global-finance-analytics-with-data-visualization-elements/ddb598bc1c13c9b3c93e14f22918b564/>PikWizard</a>
</span>
</span>
<span class="image-link">
<span
style="margin: 0 0 20px 0; display: inline-block; vertical-align: middle; width: 100%;"
>
<a
target="_blank"
href="https://pikwizard.com/photo/global-finance-analytics-with-data-visualization-elements/ddb598bc1c13c9b3c93e14f22918b564/"
style="text-decoration: none; font-size: 10px; margin: 0;"
>
<img src="https://pikwizard.com/pw/medium/ddb598bc1c13c9b3c93e14f22918b564.jpg" style="margin: 0; width: 100%;" alt="" />
<p style="font-size: 12px; margin: 0;">PikWizard</p>
</a>
</span>
</span>
Free (free of charge)
Free for personal and commercial use.
Author: People Creations
Similar Free Stock Images

Premium


Premium

Premium


Premium


Premium


Premium


Premium


Premium

Premium

Premium
Premium


Premium


Premium


Premium


Premium


Premium

Premium


Premium


Premium


Premium


Premium

Premium


Premium


Premium


Premium


Explore More Free Stock Images