1. Home > 
  2. Stock Photos > 
  3. Global Finance and Connections with Data Visualization Overlay

Global Finance and Connections with Data Visualization Overlay Image

Global Finance and Connections with Data Visualization Overlay

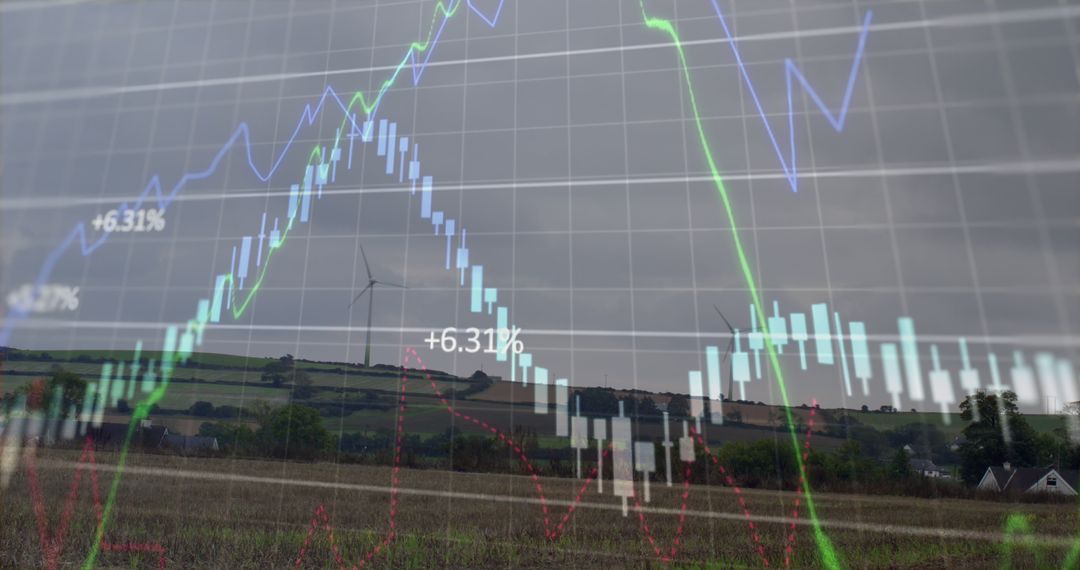
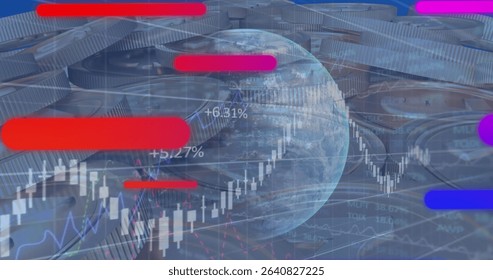
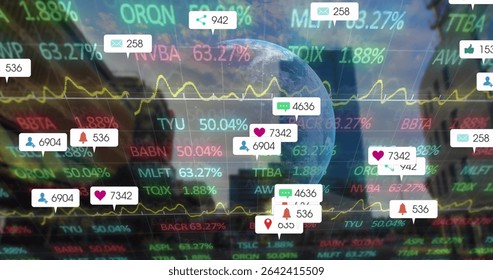
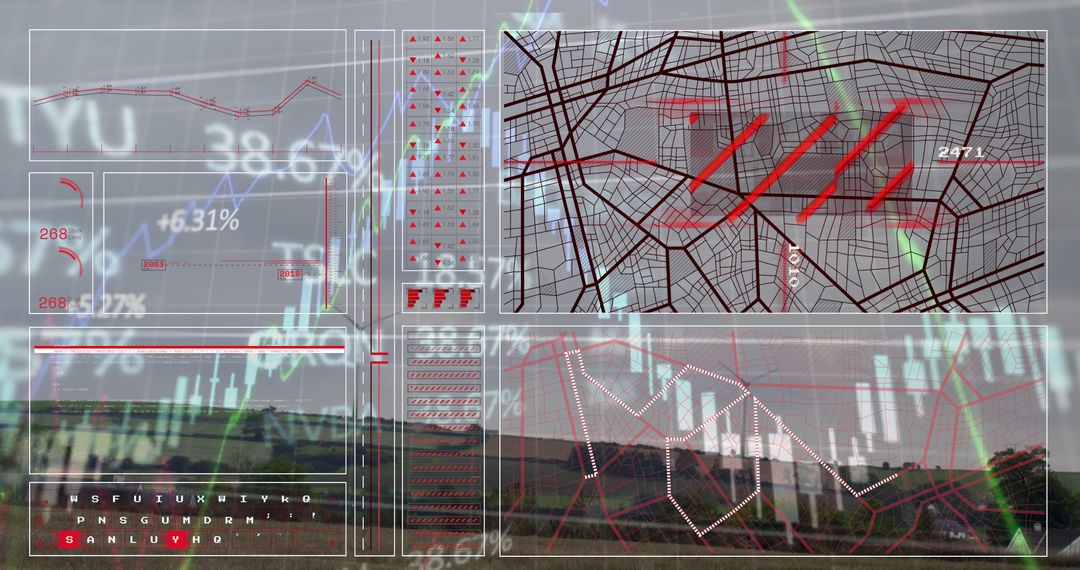
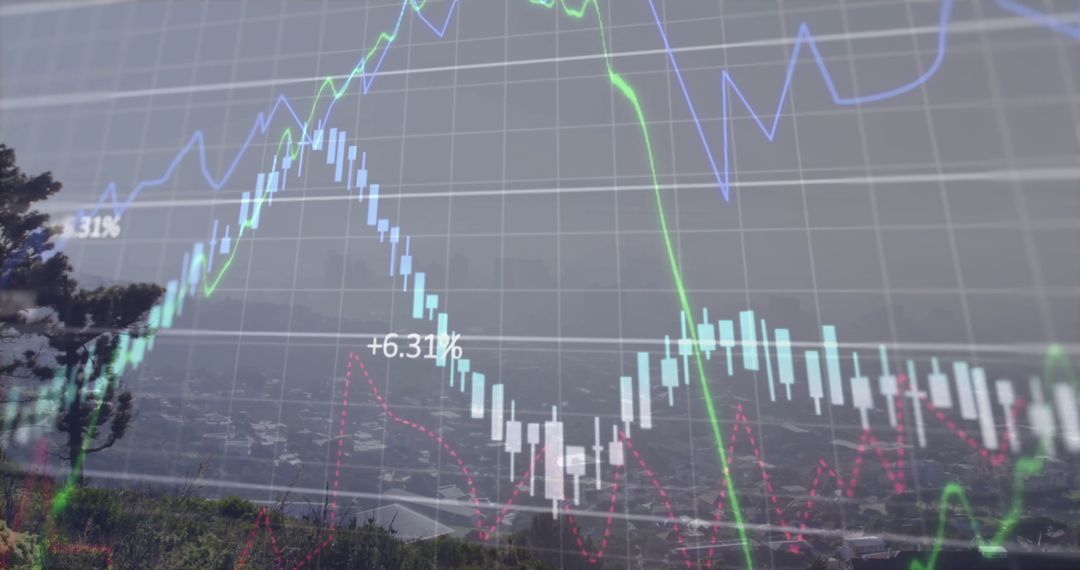
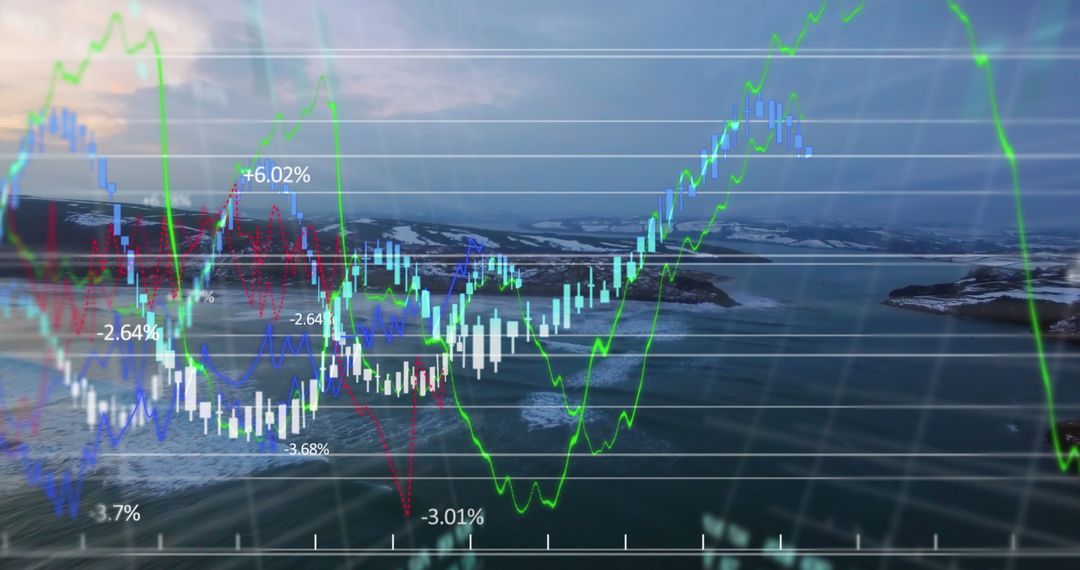
This visually engaging representation of global finance showcases technological advancements and interconnectivity. A network of global connections superimposed over financial graphs emphasizes data-driven analysis and worldwide exchanges. Useful for illustrating topics related to international finance, technological innovation, data processing, analytical practices in presentations, reports, or educational materials. Highlights global data analyzation and web of connectivity across different stratospheres.

Powered by Shutterstock logo - Get 15% off with code: PIKWIZARD15
Data and AI Powering Global Analytics: Visualize data-driven insights with AI and big data, showcasing global networks, large language models, artificial neural network and digital transformation. - Powered by Shutterstock - Get 15% off with code: PIKWIZARD15Big data analytics visualization technology by business people analyzes data structures on screen with machine learning to pull strategic forecasts for business, finance, internet of things. - Powered by Shutterstock - Get 15% off with code: PIKWIZARD15Man look at the dashboard with graphs and charts. Concept of data management system, business intelligence, data statistics, marketing analysis, key performance indicators (KPI) and analytics. - Powered by Shutterstock - Get 15% off with code: PIKWIZARD15Data science. Man programmer using digital tablet computer analyzing and develop software on futuristic virtual interface screen. Algorithm, big data analysis and management, data visualization - Powered by Shutterstock - Get 15% off with code: PIKWIZARD15Man look at the dashboard with graphs and charts. Concept of data management system, business intelligence, data statistics, marketing analysis, key performance indicators (KPI) and analytics. - Powered by Shutterstock - Get 15% off with code: PIKWIZARD15

Credit Photo

If you would like to credit the Photo, here are some ways you can do so

Free (free of charge)

Free for personal and commercial use.

Author: People Creations

Similar Free Stock Images

Digital Financial Charts Overlayed on Cityscape Background
Premium
Big data and analytics visualization technology with scientist analyzing information structure on screen with machine learning to extract predictions for business, finance, internet of things
Innovative Financial Data Integration with Digital Brain Concept
Financial Data and Growth Arrows Boosting Business Success
Digital Network Connections and Data Analytics Interface Concept
Financial Data Overlay with Cityscape Background
Premium
Spinning 3D Earth globe rotating in virtual financial data interface, with symbols and line charts. Globes, finance, data visualization, technology, investment, analytics, digital
Combining Renewable Energy with Dynamic Financial Data Visualization
Financial Market Trends Over City Lights Digital Interface Concept
Blended Financial Graph with Businessperson Silhouettes
Digital Network Connections Concept with Data Visualization
Premium
Green 3D globe floating on trading dashboard with trend lines, candlestick bars and numeric data. Technology, finance, data visualization, digital, analytics, innovation, corporate
Financial Data Overlay with Server Room Background
Digital Financial Data Over World Map in Data Center
Digital Financial Data Overlay on Urban Skyscrapers
Quantitative Data Analysis Displayed in Office Workspace
Premium
Displaying candlestick chart bars and purple dotted trend arrow on data interface, with world map. Finance, data visualization, digital interface, analytics, technology, innovation, business
Financial Data and Graphs Overlaying Urban Cityscape
Financial Graphs Overlaying Cityscape Illustrate Global Economy
Digital Stock Data Over City Landscape Illustrating Global Economy
Stock Market Trends Overlay on Cityscape at Night
Premium
Back rear view of young asian woman, freelance data scientist work remotely at home coding programing on Big data mining, AI data engineering, IT Technician Works on Artificial Intelligence Project.
Digital Stock Market Growth with Data Visualization
Virtual Financial Data Overlay on City Skyline
Digital Economy Visualization With Graphs and Technology Overlay
Global Data Analytics and Wind Energy Technology Integration
Premium
Transparent globe connecting containers, candlestick charts, % markers, color bars in digital scene. Globalization, logistics, finance, data visualization, industrial, technology, economic
Digital Charts Highlighting Global Finance Data Insights
Financial Data Visualization with Dynamic Graphical Analysis
Global Currency Symbols and Financial Network Graph
Dynamic Digital Interface Displaying Financial Data Analysis
Abstract Digital Finance Graph Interface Display
Global Digital Network and Interfaces Concept
Premium
Showing dashboard plotting line and bar charts on blue grid, with world map and numeric overlays. Analytics, visualization, data, technology, finance, dashboards, growth
Financial Data Overlay on Urban and Natural Landscape
Digital Data Processing Overlay on Night Cityscape
Abstract Financial Graphs Overlapping Urban Skyline
Abstract Financial Data Display with Analytical Graphs
Premium
Interactive Data Visualization Professional Engages With Data Driven Marketing Insights For Global Business Intelligence, Utilizing Tablet Analysis World Map Visualization For Informed Decision-Making
Digital Financial Analytics Over Construction Backdrop
Businesswoman Analyzing Financial Data with Mixed Reality Interface
Financial Graphs and Cityscape Merging Conceptualizing Economy
Digital Financial Graph Over Cityscape at Dusk
Premium
Hands holding a tablet with glowing bar and line charts, global map, and financial data visuals on a dark background. Concept of stock market analytics
Global Financial Data Processing with Networking Symbols
Futuristic Data Processing and Global Network Interface Display
Eco-Friendly Business Concept with Stock Market Data
Network Connections Overlay on Computer Servers Symbolizing Data Processing
Premium
Close up businesswoman collecting data information converting into statistics, planning strategy gathering resources creating visual graphical graphs using computer laptop and smart mobile device
Financial Data with Digital Interface Overlaid on Urban Skyline
Technology Interface Overlaying Cityscape Analytic Concept
Global Financial Market Positive Trend Visualization
Abstract Digital Graph with Fluctuating Connectivity Lines
Premium
Businessman works with financial data. Futuristic 3d interface above laptop computer. Interactive financial diagrams and digital data visualization concept. Global e-business network communication
Digital Connectivity Network on Global Graph Background
Visuals Exploring Business Analytics and Digital Connectivity
Innovative Business Graphs and Data Technology in Urban Setting
Data Processing Graphic Over Modern Cityscape
Premium
Showing Earth globe hovering over city skyline, displaying stock tickers, graphs and social icons. Digital finance, data visualization, global connectivity, social engagement, modern technology,
Global Digital Data Processing on World Map with Graph and Network Overlay
Digital Network Interface with Data Visualizations and Icons
Futuristic Data Analytics Dashboard with Security Icon
Global Financial Data Processing Digital Interface
Finance Data Learning: Economic Trends and Market Analysis
Global Financial Markets and Technology Analysis
Premium
Conceptual visual of data analysis with black woman working in the office
Global Financial Data Overlay on Urban Skyline for Business Concept
Digital Interface with Stock Market Data and Windmills
Cityscape Overlaid with Financial and Stock Market Data
Digital Financial Data with City Skyline Background
Premium
Image of multicolored infographic interface over rotating globe against space. Digitally generated, hologram, illustration, report, business, growth, progress and globalization concept.
Global Financial Data and Digital Interface Concepts
Global Data Exchange and Stock Market Analysis Over World Map
Global Financial Data Visualization Over World Map
Financial Chart Analysis with Market Data Visuals on Black Background
Premium
Image of scope scanning and financial data processing over cityscape. Global finance, business, connections, computing and data processing concept digitally generated image.
Digital Financial Data Graph with Winter Snowflake Theme
Digital Financial Graphs Overlaying Cityscape
Financial Data Overlay with Urban Background Illustration
Financial Data on Virtual Screen with Urban Background
Premium
Global Financial Network - Currency Exchange, Digital Money Transfer, Earth Fintech Data Visualization, Blockchain Economy, Globalization, Investment, Crypto, Banking, World Trade
Digital Icons and Stock Data Illustrating Global Finance Network
Dynamic Financial Data and Arrows with Technology Interface
Stock Market Graph Reflecting Financial Trends and Analysis
Futuristic Financial Trading Graph and Data Visualization
Premium
Data visualization technology showcases global market trends in a corporate environment
Digital Data Analysis Overlapping Modern Urban Skyline
Animated Stock Market Data Over Cityscape
Futuristic Graphs Process Financial Data Over City Skyline
Financial Data Analysis and Cityscape Merge
Premium
Presenting planet Earth against dark blue grid with red downward trending graph numeric data labels. Global finance, data analytics, economic downturn, digital visualization, market trends, investment
Digital Interface with Data Analytics and Connectivity Overview
Financial Data Visualization Over Mountain Panorama
Geopolitical Data Projection with Power Lines and Map Overlay
Global Financial Data Interface with Rotating Globe Overlay
Global Data Processing Interface Concept with Earth
Digital Financial Data and Technology Visualization
Premium
Big data analytics visualization technology with scientist analyzing information structure on screen with machine learning to extract strategical prediction for business, finance, internet of things
Financial Technology Overlaying Bustling Cityscape at Night
Global Economic Trends Overlapping Environmental Issues
3D Grid with Dynamic Financial Data Visualization
Digital Graphs Overlaying Cityscape Reflecting Economic Trends
Premium
A magnifying glass over a financial chart, illustrating market analysis and business concepts, in blue light against a dark background.
City Skyline Merging with Financial Graphs Demonstrating Market Trends
Abstract Financial Graphs Overlapping Data Center
Abstract Financial Data and Trends Analysis
Stock Market Graphs Overlay on City Skyline Backdrop
Premium
Displaying Earth globe overlaying candlestick charts and line graphs at riverside, with binary code. Global, finance, data, technology, investment, analytics, growth
Digital Interface Overlay with Mathematical Equations and Media Icons
Dynamic Global Financial Data Overlaying Cityscape
Financial Graphs Merging with Coastal Landscape
Financial Data Analytics Over NY Cityscape, Digital Trends Display
Premium
Displaying Union Jack flag draping world map on display, with bar line arrow and timestamp overlays. Patriotism, globalization, analytics, digital, innovation, finance, data visualization
Digital Financial Data Displayed Over Glass Office Buildings
City Skyline with Abstract Financial Graph Overlay
Futuristic Financial Data Display with Stock Market Analysis
Composite of Financial Graphs and Code with City Night Traffic
Premium
Business development and technology Data analyst. business analytics dashboard Business Intelligence (BI) data visualization, metrics and KPI key performance indicators and reports management.
Global Stock Market Trading and Financial Analytics
Digital Financial Graph Overlay on Empty Modern Office
Dynamic Data Visualization with Urban Background
Digital Interface with Scanning Lines and Data Symbols
Premium
Displaying ticker tracking symbols and % figures on trading floor, with line charts and globe icons. Technology, finance, data visualization, digital, analytics, corporate, modern
Displaying financial growth dashboard with bold upward arrow, line charts, dotted bar analytics