
- Home >
- Stock Photos >
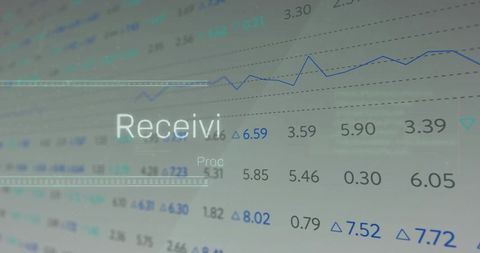
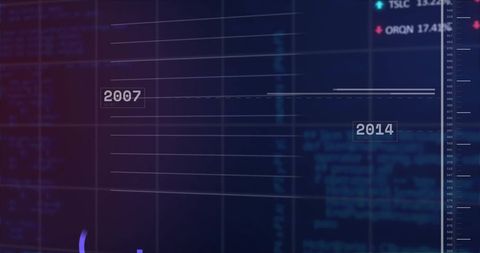
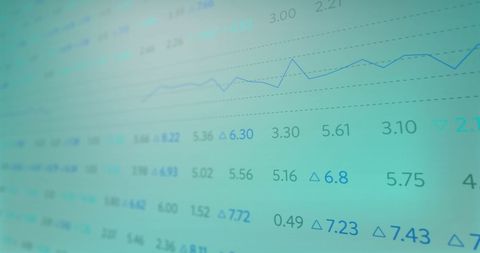
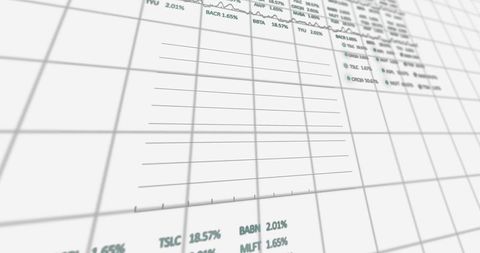
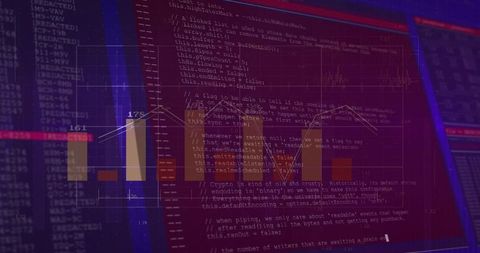
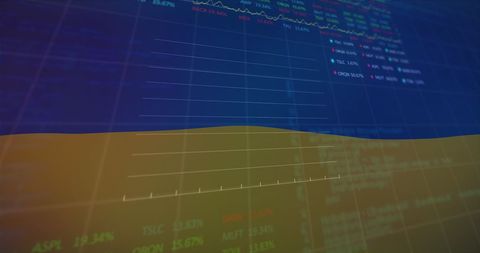
- Global Finance and Data Visualization Interface Background
Global Finance and Data Visualization Interface Background Image

Abstract background featuring financial data chart with global business trends and stock market indicators. Ideal for illustrating news articles, reports, and presentations on finance, stock trading, cyber security, and data processing in a dynamic, digital context.
Powered by 


downloads
Tags:
More
Credit Photo
If you would like to credit the Photo, here are some ways you can do so
Text Link
photo Link
<span class="text-link">
<span>
<a target="_blank" href=https://pikwizard.com/photo/global-finance-and-data-visualization-interface-background/7c17d037ea17fb847af0493cbe3e88c1/>PikWizard</a>
</span>
</span>
<span class="image-link">
<span
style="margin: 0 0 20px 0; display: inline-block; vertical-align: middle; width: 100%;"
>
<a
target="_blank"
href="https://pikwizard.com/photo/global-finance-and-data-visualization-interface-background/7c17d037ea17fb847af0493cbe3e88c1/"
style="text-decoration: none; font-size: 10px; margin: 0;"
>
<img src="https://pikwizard.com/pw/medium/7c17d037ea17fb847af0493cbe3e88c1.jpg" style="margin: 0; width: 100%;" alt="" />
<p style="font-size: 12px; margin: 0;">PikWizard</p>
</a>
</span>
</span>
Free (free of charge)
Free for personal and commercial use.
Author: People Creations
Similar Free Stock Images

Premium


Premium


Premium


Premium

Premium

Premium


Premium

Premium


Premium


Premium


Premium

Premium

Premium


Premium


Premium


Premium


Premium


Premium


Premium


Premium


Premium


Premium


Premium


Premium


Premium

Explore More Free Stock Images