- Home >
- Stock Photos >
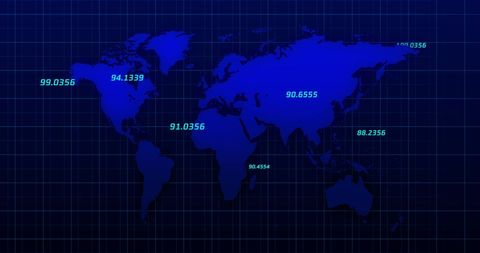
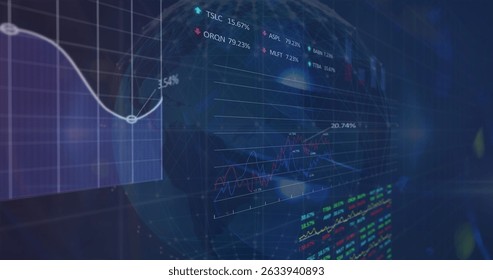
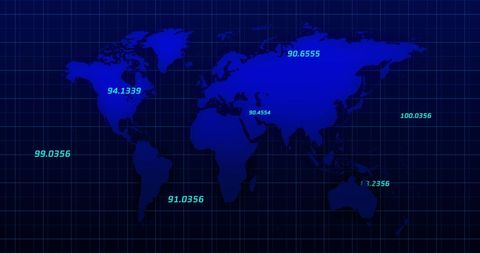
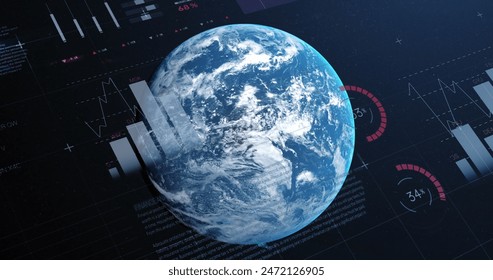
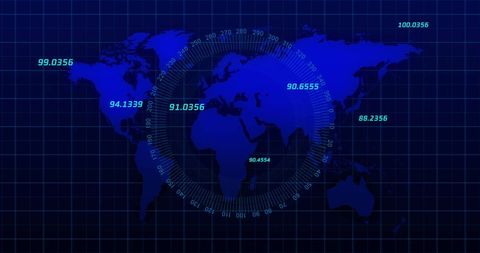
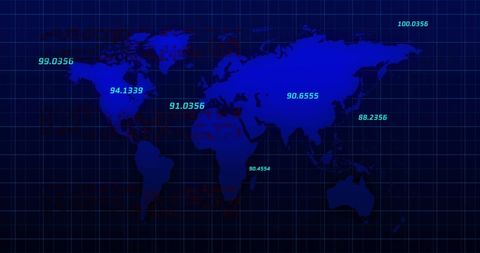
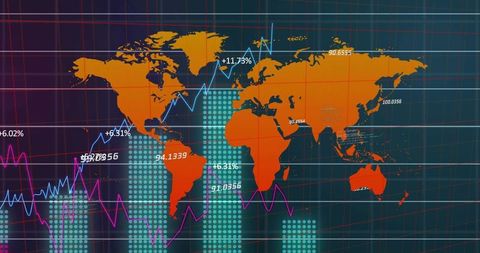
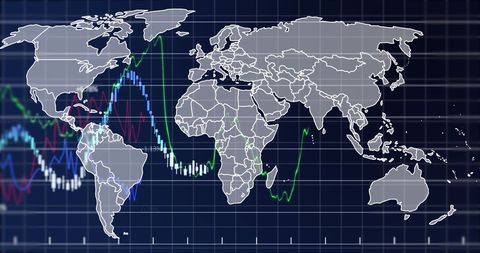
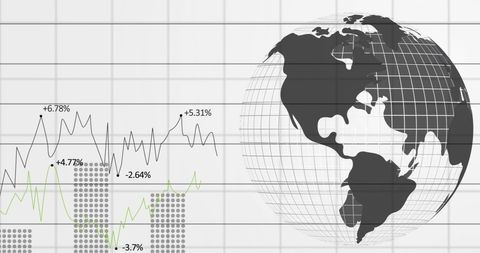
- Global Finance and Economy Interface with Digital Graphs
Global Finance and Economy Interface with Digital Graphs Image

Dynamic depiction of global finance with vibrant digital graphs overlaying a rotating globe. This image illustrates the intersection of technology and economics, showcasing financial data and market trends. Ideal for publications on international finance, reports on economic growth, and presentations about global markets and investment strategies. Suitable for websites and media resources discussing technology's role in finance.
Powered by  - Get 15% off with code: PIKWIZARD15


2
downloads
downloads
Tags:
More
Credit Photo
If you would like to credit the Photo, here are some ways you can do so
Text Link
photo Link
<span class="text-link">
<span>
<a target="_blank" href=https://pikwizard.com/photo/global-finance-and-economy-interface-with-digital-graphs/3c59fae9cd42682777b9ec23765a3466/>PikWizard</a>
</span>
</span>
<span class="image-link">
<span
style="margin: 0 0 20px 0; display: inline-block; vertical-align: middle; width: 100%;"
>
<a
target="_blank"
href="https://pikwizard.com/photo/global-finance-and-economy-interface-with-digital-graphs/3c59fae9cd42682777b9ec23765a3466/"
style="text-decoration: none; font-size: 10px; margin: 0;"
>
<img src="https://pikwizard.com/pw/medium/3c59fae9cd42682777b9ec23765a3466.jpg" style="margin: 0; width: 100%;" alt="" />
<p style="font-size: 12px; margin: 0;">PikWizard</p>
</a>
</span>
</span>
Free (free of charge)
Free for personal and commercial use.
Author: Creative Art
Similar Free Stock Images
Loading...
Premium


Premium

Premium

Premium


Premium


Premium


Premium


Premium

Premium


Premium


Premium


Premium


Premium


Premium

Premium


Premium

Premium


Premium


Premium


Premium


Premium

Premium


Premium


Premium


Premium