
- Home >
- Stock Photos >
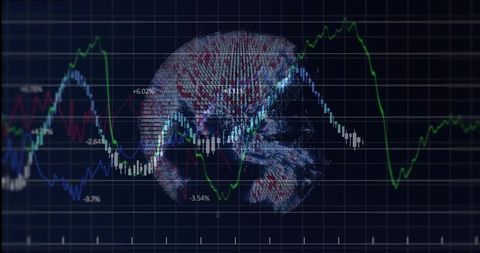
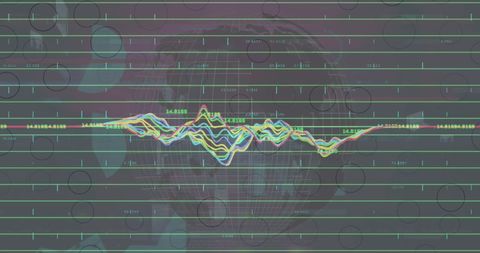
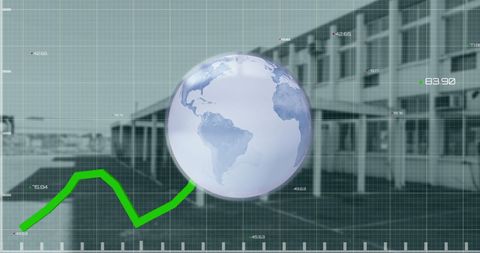
- Global Finance Data Analytics in Digital Display
Global Finance Data Analytics in Digital Display Image

Abstract representation of global finance statistics, featuring a transparent globe and fluctuating data lines against a digitally-rendered background. Ideal for illustrating reports or articles on financial technology, data analytics, market analysis, and computational economics.
Powered by 


downloads
Tags:
More
Credit Photo
If you would like to credit the Photo, here are some ways you can do so
Text Link
photo Link
<span class="text-link">
<span>
<a target="_blank" href=https://pikwizard.com/photo/global-finance-data-analytics-in-digital-display/5eecce4f95a41ac5bc56f77fd4f471a3/>PikWizard</a>
</span>
</span>
<span class="image-link">
<span
style="margin: 0 0 20px 0; display: inline-block; vertical-align: middle; width: 100%;"
>
<a
target="_blank"
href="https://pikwizard.com/photo/global-finance-data-analytics-in-digital-display/5eecce4f95a41ac5bc56f77fd4f471a3/"
style="text-decoration: none; font-size: 10px; margin: 0;"
>
<img src="https://pikwizard.com/pw/medium/5eecce4f95a41ac5bc56f77fd4f471a3.jpg" style="margin: 0; width: 100%;" alt="" />
<p style="font-size: 12px; margin: 0;">PikWizard</p>
</a>
</span>
</span>
Free (free of charge)
Free for personal and commercial use.
Author: Awesome Content
Similar Free Stock Images

Premium

Premium


Premium


Premium


Premium


Premium


Premium


Premium


Premium


Premium

Premium


Premium


Premium


Premium


Premium


Premium


Premium


Premium


Premium


Premium


Premium


Premium


Premium


Premium


Premium


Explore More Free Stock Images