1. Home > 
  2. Stock Photos > 
  3. Global Finance Data on Digital Dark Background

Global Finance Data on Digital Dark Background Image

Global Finance Data on Digital Dark Background

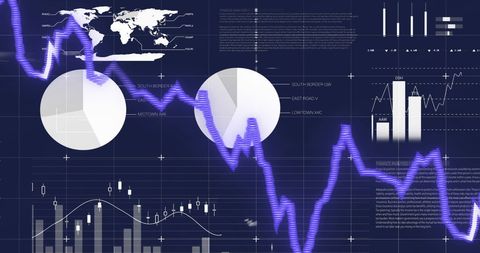
This visually engaging design combines maps, charts, and graphs on a dark background highlighting global finance and data. It is ideal for presentations, financial reports, or articles discussing economic trends, market analysis, or data-driven decision making.

Powered by Adobe logo
Financial data analytics processing with futuristic technology dashboard - Powered by AdobeProfessional hands typing on a laptop amidst financial graphs, showcasing data analysis and growth trends in a modern office setting. Perfect for finance themes. Copula - Powered by AdobeDigital data analyzing financial market charts with neon lights - Powered by AdobeAI payroll system interface showing employee salary data, budgeting graphs, and monthly calendar used on laptop for digital finance management and automated compensation planning in business setup - Powered by AdobeAn illustrative digital rendering, a dynamic display of data visualizations, glowing in shades of electric blue. ..Created with Generative AI, not depicting real subjects. - Powered by Adobe

Credit Photo

If you would like to credit the Photo, here are some ways you can do so

Free (free of charge)

Free for personal and commercial use.

Author: People Creations

Similar Free Stock Images

Colorful Stock Market Graph Displaying Economic Trends
Premium
Businesswoman working on laptop with analytics graphs displayed on screen inside warehouse. Concept of logistics, supply chain, inventory management, shipping, ecommerce and distribution.
Dynamic Digital Stock Market Ticker with Growing Graph Trends
Financial Data Displayed Over City Skyline with Rising Graphs
Financial Data Visualization Over Futuristic Cityscape
Financial Data Streaming with Arrows Over Graphic Indicators
Premium
Businessman's hand touching a glowing virtual bar chart displaying increasing financial data and various business process icons, representing progress and digital transformation
Financial Data Charts with World Map on Blue Digital Background
Dynamic Green Stock Chart on Digital Grid Background
Dynamic Stock Market Data Visualization on Digital Screen
Fluctuating Digital Stock Market Data Chart
Premium
Digital data analysis and form checklist. Businessman using magnifying glass on document, analyzing reports, reviewing performance, and verifying online tasks with technology.
Abstract Digital Interface for Medical Data Processing
Dynamic Data Visualization and Financial Growth Curves
Dynamic Multicolored Graphs on Abstract Digital Finance Background
Growth Trend with Green Line Overlay and Modern Cityscape
Premium
Defocused visualization of AI neural networks processing financial data and predictive analytics for smart investments, with copy space.
Dynamic Forex Trading Graphs with Increasing Numbers
Financial Data Processing with Rising Graphs
Digital Financial Data and Multicurrency Exchange Charts
Rising Financial Data Graph on Digital Grid Background
Premium
A business professional is engaged in data analysis, with a digital graph overlay on a keyboard, symbolizing growth and success in contemporary finance and analytics. Copula
Dynamic Financial Graphs and Data Analysis Interface
Data Analysis Graphics on Digital Grid Background
Soundwave Visualization and Data Analysis on Digital Grid
Analyzing Financial Data on Digital World Map Background
Premium
Hands Holding Abstract Blue and Red Data Visualization.
Dynamic Data Graphs Display on Dark Digital Background
Digital Financial Data Visualization on Dark Screen
Innovative Data Analysis over DNA Strand
Dynamic Financial Data Analysis with Graph Overlays
Premium
Business analysis reports with charts and graphs. Integrated content management platform. Digital document automation. Businessperson holding reports.
Dynamic Stock Market Graph with Vibrant Color Lines on Grid
Red Declining Graph on Digital Grid Display Represents Falling Markets
Premium
Digital data analysis displaying financial growth graph in technology interface
Rising Stock Market Trend with Digital Data Analytics
Digital Financial Data with Arrows Indicating Growth
Digital Financial Data with Trending Arrows
Dynamic Financial Graphs Over Cityscape Background
Premium
Digital data wave analyzing technology network background
Dynamic Financial Graphs Illustrating Market Trends
Digital Finance: Modern Stock Market Analysis Display
Green Line Rising on Digital Trading Board with Abstract Background
Futuristic Stock Market Graph With Digital Overlay
Premium
Person typing on laptop with holographic data charts and graphs overlay analytics statistics
Abstract Financial Data with Dynamic Graphs on Blue Background
Financial Data Processing with Digital Patterns for Global Business
Rising Graphs and Interactive Financial Data Analytics Background
Dynamic Financial Data Chart Display with Graphical Analysis
Premium
financial data processing in an office setting for a variety of businesspeople
Digital Analysis of Financial Data with Dynamic Graphs
Dynamic Statistical Data Analysis on Digital Grid Network
Dynamic Financial Data Visualization on Digital Grid Background
Digital Financial Data Analytics Overlay in Modern Office
Premium
Digital data analysis displaying financial market trends
Financial Data Analysis Vibrant Graphs on Blue Background
Dynamic Stock Market Analysis Concept Artwork
Financial Data Analysis with Interactive Graphs
Financial Graphs and Digital Data on Dark Background
Premium
Big data analyzing business finance information dashboard
Abstract Financial Data Processing and Analysis Interface
Dynamic Financial Data with Fluctuating Graph Lines
Financial Growth Statistic Data Processing Over Urban Cityscape
Dynamic Financial Data Graph in Digital Grid Display
Dynamic Stock Market Trends with Graphs on Digital Display
Rising Stock Market Trends and Chart Analysis
Premium
Digital display showing vibrant blue, pink, and purple graphs and data visualizations
Financial Data Analysis with Growth Trend Arrows on Digital Interface
Dynamic Financial Market Trends with Data Visualizations
Global Financial Data Analysis with World Map Visualization
Financial Data Flow against Urban Skyline Backdrop
Premium
Big data and AI technology, Business intelligence and AI data science, Automating data processing, Machine learning and business intelligence, AI driven data processing, KPI performance monitoring.
Digital Financial Display with Graphs and Data Analysis
Colorful Data Visualization Graphs on Digital Grid
Dynamic Stock Market Data on Digital Interface
Data Security with Tech Bar Graph Overlay
Premium
AI integration system connecting data, cloud, automation, API, and analytics through a central AI core, futuristic glowing circuit lines, Holographic UI overlay for business and technology solutions
Dynamic Financial Growth Digital Chart Display
Overlay of Financial Data on Business People in Office Building
Declining Graph Overlay on Night Traffic Scene Illustrates Downtrend
Digital Financial Chart Showing Growth and Dynamic Indicators
Premium
Business professional interacting with a digital interface displaying a verified checkmark and various icons representing business processes and data analysis on a tablet screen
Financial Graphs with Social Media Analytics on Digital Chart
Tech-Focused Financial Data Visualization with Rising Graphs
Dynamic Financial Data Against Urban Skyline
Digital Chart Display Financial Data Analysis Background Effects
Premium
Businessman holding magnifying glass over digital checkboxes and analytics documents representing data verification and whitelist concept on dark background.
Dynamic Stock Market Data Analysis With Graphs and Percentages
Global Financial Data Analysis with Colorful Graphs
Dynamic Stock Market Graph Showing Investment Trends
Financial Data Analysis with Growing Stock Trends
Premium
Magnifying glass with wooden circles showing graph chart and computer icon, concept of data analysis, statistics, business intelligence, performance evaluation
Dynamic Stock Market Chart with Fluctuating Trends and Data Points
Fluctuating Stock Market Graph with Dramatic Peaks
Colorful Stock Market Graph with Data on Grid
Dynamic Stock Market Graphs Indicating Financial Trends
Digital Financial Data Interface with Analytics
Dynamic Financial Data Graphs Networking in Global Business
Premium
Robotic hand analyzing rising financial chart with glowing data spikes on digital interface, symbolizing futuristic AI-driven market technology concept. Ai generative
Financial Data Visualization with Cityscape Overlay
World Map with Falling Line Graphs Indicating Global Economic Decline
Dynamic Financial Data Streams for Market Analysis
Financial Stock Market Data Analysis on Digital Interface
Premium
Magnifying glass over blue bar and line graphs highlighting data analysis
Dynamic Financial Graph on Digital Background
Dynamic Global Market Trends Over World Map Visualization
Digital Financial Data Analysis with Graphs and Stock Market Trends
Analyzing Financial Market Trends with Data Visualization
Premium
Magnifying glass document management checklist. Magnifying glass check mark approved. Audit certificate evaluate examination reviewing. Magnifying inspector inspect quality Assurance selection summary
Futuristic Digital Finance World Map with Dynamic Data
Digital Stock Market Green Graph Against Dark Trading Board
Financial Data Analysis in Digital Interface with Graphs
Financial Growth Graph and Data Analytics Representation
Premium
Abstract data visualization illustrating big data analytics and global financial markets
Graphical Data Analysis on Digital Interface
Dynamic Stock Market Visual in Modern Office Setting
Inflation Analytics: Graphic Representation of Stock Market Trends
Financial Data Analysis with Abstract Chart Grid Overlay
Premium
Digital blue stock market analysis graph showing fluctuation and data processing on screen display.
Dynamic Financial Data Overlaid on Grid Background
Glowing Financial Graph with World Map in Dark Background
Digital Data Waveform on High-Tech Interface
Fluctuating Financial Graph on Digital Orange Background
Premium
A close-up of digital data visualized as lines and vertical bars in varying shades of blue
Abstract Global Connectivity Diagram With World Map