
- Home >
- Stock Photos >
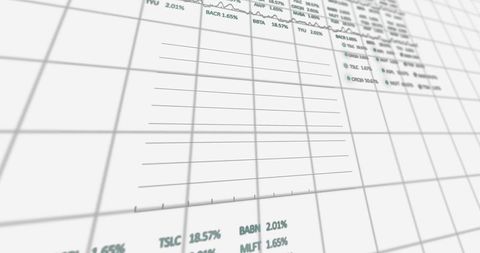
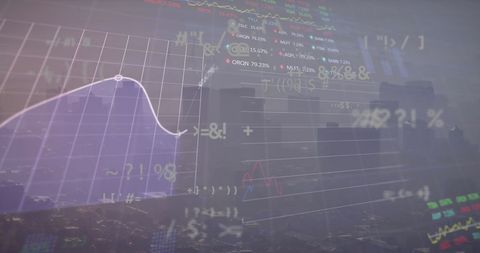
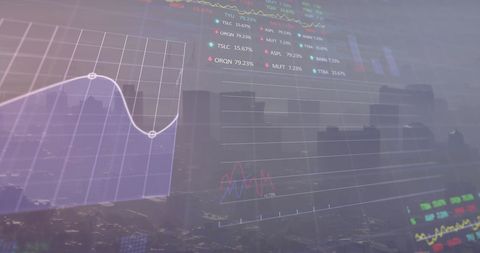
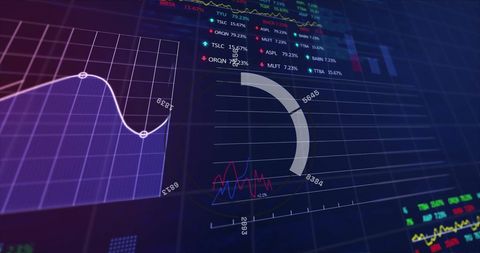
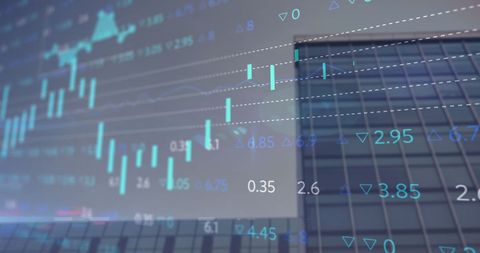
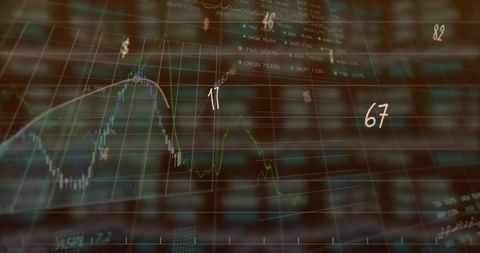
- Global Finance Data Processing Over Digital Grid Background
Global Finance Data Processing Over Digital Grid Background Image

Detailed visualization of financial data being processed over a digital grid, illustrating complex business calculations and analysis concepts. This dynamic depiction is ideal for use in presentations about global finance, economic trends, data science, or blockchain technology integration. Suitable for educational articles, finance reports, and marketing materials centered on digital computing and financial analytics.
Powered by 


downloads
Tags:
More
Credit Photo
If you would like to credit the Photo, here are some ways you can do so
Text Link
photo Link
<span class="text-link">
<span>
<a target="_blank" href=https://pikwizard.com/photo/global-finance-data-processing-over-digital-grid-background/72d4986d54a6cc13d810ed432ec1e522/>PikWizard</a>
</span>
</span>
<span class="image-link">
<span
style="margin: 0 0 20px 0; display: inline-block; vertical-align: middle; width: 100%;"
>
<a
target="_blank"
href="https://pikwizard.com/photo/global-finance-data-processing-over-digital-grid-background/72d4986d54a6cc13d810ed432ec1e522/"
style="text-decoration: none; font-size: 10px; margin: 0;"
>
<img src="https://pikwizard.com/pw/medium/72d4986d54a6cc13d810ed432ec1e522.jpg" style="margin: 0; width: 100%;" alt="" />
<p style="font-size: 12px; margin: 0;">PikWizard</p>
</a>
</span>
</span>
Free (free of charge)
Free for personal and commercial use.
Author: Creative Art
Similar Free Stock Images

Premium


Premium

Premium


Premium


Premium

Premium


Premium


Premium


Premium

Premium


Premium


Premium


Premium


Premium


Premium

Premium


Premium


Premium

Premium

Premium

Premium


Premium

Premium


Premium


Premium


Explore More Free Stock Images