- Home >
- Stock Photos >
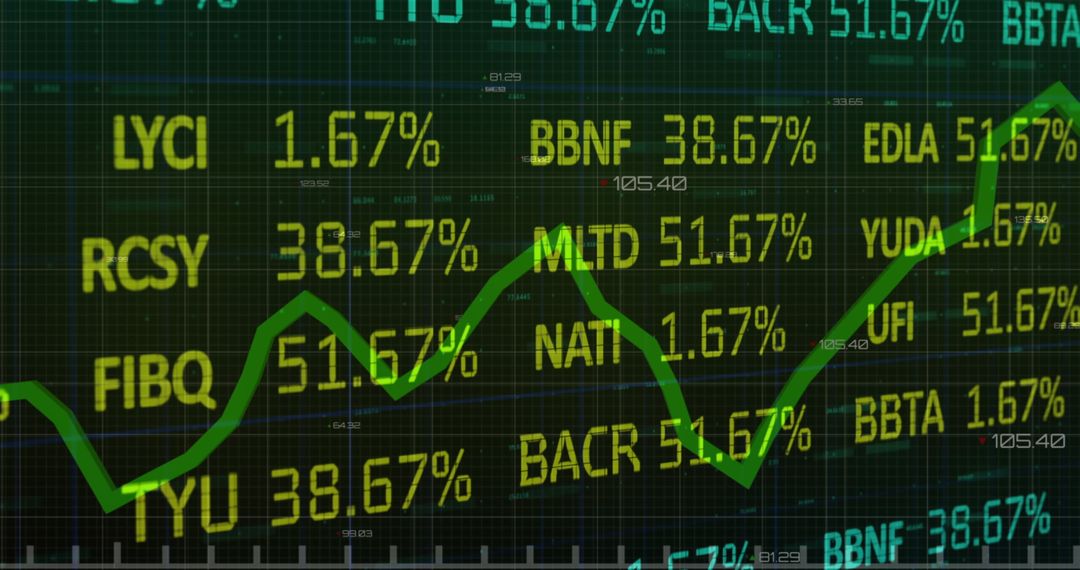
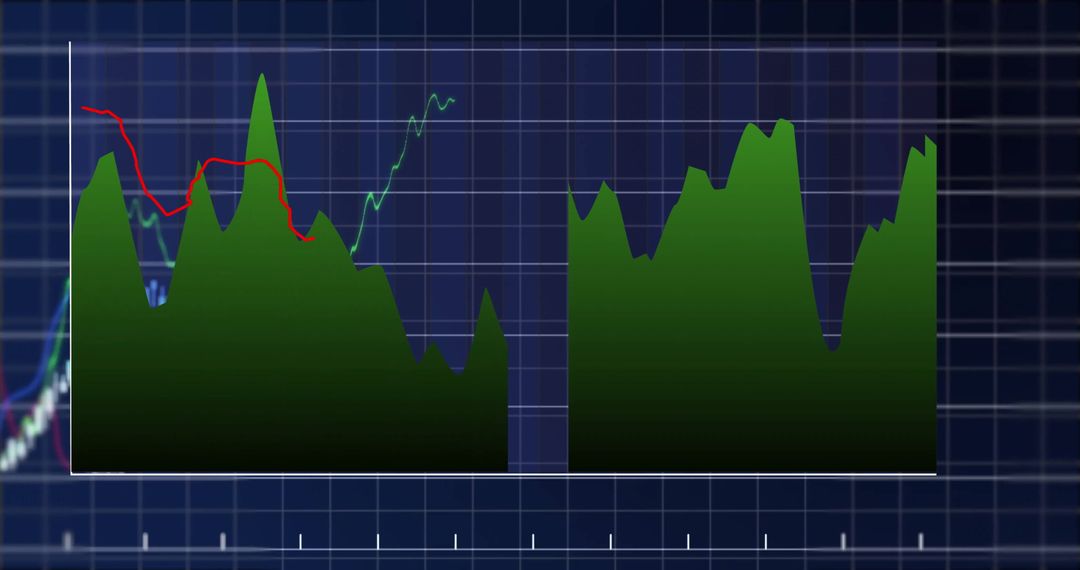
- Global Finance Data Processing with Green Trend Line
Global Finance Data Processing with Green Trend Line Image
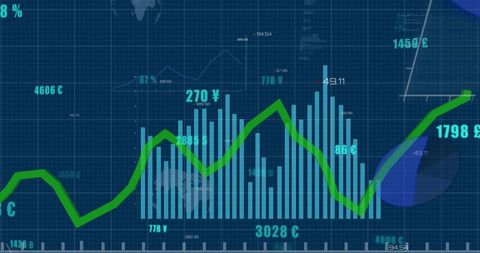
Global finance and business background features dynamic data and statistics with green trend line. Ideal for illustrating economic concepts, financial growth analysis, or digital computing themes. Usable for presentations, articles, and educational materials related to global currency exchange and business forecasting.
Powered by  - Get 15% off with code: PIKWIZARD15


0
downloads
downloads
Tags:
More
Credit Photo
If you would like to credit the Photo, here are some ways you can do so
Text Link
photo Link
<span class="text-link">
<span>
<a target="_blank" href=https://pikwizard.com/photo/global-finance-data-processing-with-green-trend-line/7cc6375d89fc94728c1884ff86811299/>PikWizard</a>
</span>
</span>
<span class="image-link">
<span
style="margin: 0 0 20px 0; display: inline-block; vertical-align: middle; width: 100%;"
>
<a
target="_blank"
href="https://pikwizard.com/photo/global-finance-data-processing-with-green-trend-line/7cc6375d89fc94728c1884ff86811299/"
style="text-decoration: none; font-size: 10px; margin: 0;"
>
<img src="https://pikwizard.com/pw/medium/7cc6375d89fc94728c1884ff86811299.jpg" style="margin: 0; width: 100%;" alt="" />
<p style="font-size: 12px; margin: 0;">PikWizard</p>
</a>
</span>
</span>
Free (free of charge)
Free for personal and commercial use.
Author: Authentic Images
Similar Free Stock Images

Premium


Premium


Premium


Premium


Premium


Premium


Premium


Premium


Premium


Premium


Premium


Premium


Premium


Premium


Premium


Premium


Premium


Premium


Premium


Premium


Premium


Premium


Premium


Premium