
- Home >
- Stock Photos >
- Global Finance Data Processing with World Map Visualization
Global Finance Data Processing with World Map Visualization Image

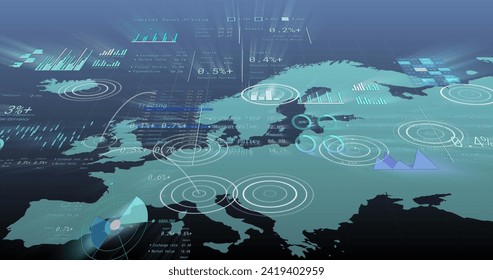
Conceptual display blends data processing and financial dynamics overlaid onto world map visualization. Financial statistics, featuring percentages and numerical data, illustrated across map to suggest globalization and interconnected economy. Use in projects involving international markets, data analysis, or academic research on geography-based financial trends.
Powered by  - Get 15% off with code: PIKWIZARD15


downloads
Tags:
More
Credit Photo
If you would like to credit the Photo, here are some ways you can do so
Text Link
photo Link
<span class="text-link">
<span>
<a target="_blank" href=https://pikwizard.com/photo/global-finance-data-processing-with-world-map-visualization/5e25aa3e0841bae7e1d99231c50dc493/>PikWizard</a>
</span>
</span>
<span class="image-link">
<span
style="margin: 0 0 20px 0; display: inline-block; vertical-align: middle; width: 100%;"
>
<a
target="_blank"
href="https://pikwizard.com/photo/global-finance-data-processing-with-world-map-visualization/5e25aa3e0841bae7e1d99231c50dc493/"
style="text-decoration: none; font-size: 10px; margin: 0;"
>
<img src="https://pikwizard.com/pw/medium/5e25aa3e0841bae7e1d99231c50dc493.jpg" style="margin: 0; width: 100%;" alt="" />
<p style="font-size: 12px; margin: 0;">PikWizard</p>
</a>
</span>
</span>
Free (free of charge)
Free for personal and commercial use.
Author: Awesome Content