- Home >
- Stock Photos >
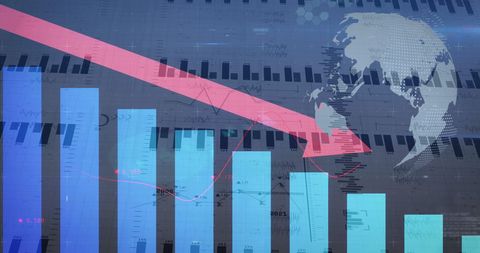
- Global Finance Downturn with Red Arrow and Bubbles
Global Finance Downturn with Red Arrow and Bubbles Image

This concept art visualizes a financial downturn with a red arrow pointing downwards amidst blue bar graphs and bubbles, symbolizing an economic decline. Ideal for articles and reports about global finance, business challenges, economic recession, or investment analysis. Use in presentations to illustrate risk management or market fluctuations.
Powered by 


downloads
Tags:
More
Credit Photo
If you would like to credit the Photo, here are some ways you can do so
Text Link
photo Link
<span class="text-link">
<span>
<a target="_blank" href=https://pikwizard.com/photo/global-finance-downturn-with-red-arrow-and-bubbles/d5139536a497038c164274c649b21074/>PikWizard</a>
</span>
</span>
<span class="image-link">
<span
style="margin: 0 0 20px 0; display: inline-block; vertical-align: middle; width: 100%;"
>
<a
target="_blank"
href="https://pikwizard.com/photo/global-finance-downturn-with-red-arrow-and-bubbles/d5139536a497038c164274c649b21074/"
style="text-decoration: none; font-size: 10px; margin: 0;"
>
<img src="https://pikwizard.com/pw/medium/d5139536a497038c164274c649b21074.jpg" style="margin: 0; width: 100%;" alt="" />
<p style="font-size: 12px; margin: 0;">PikWizard</p>
</a>
</span>
</span>
Free (free of charge)
Free for personal and commercial use.
Author: Authentic Images