
- Home >
- Stock Photos >
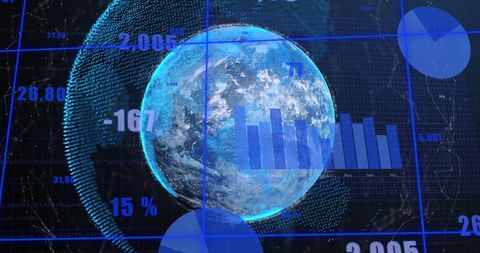
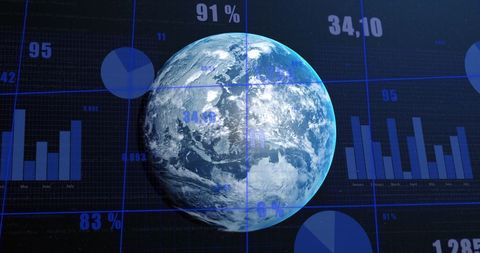
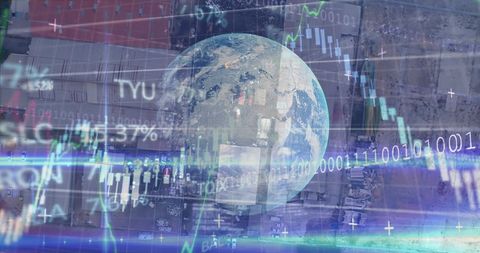
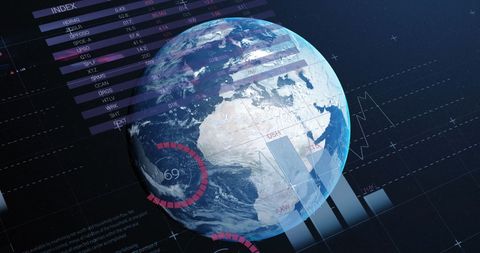
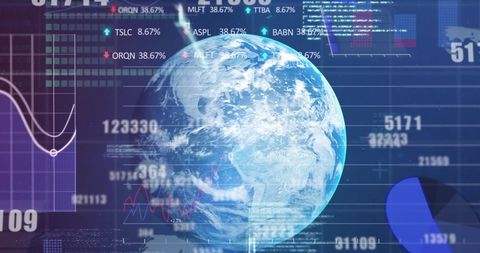
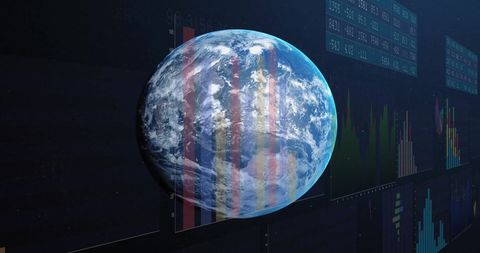
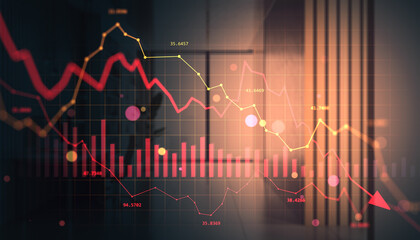
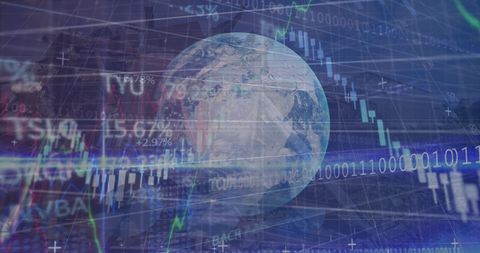
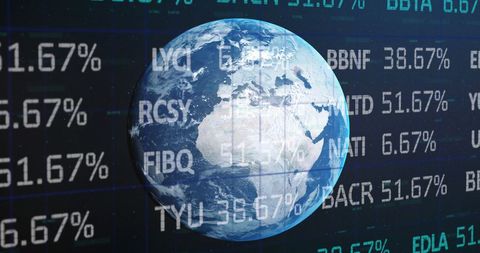
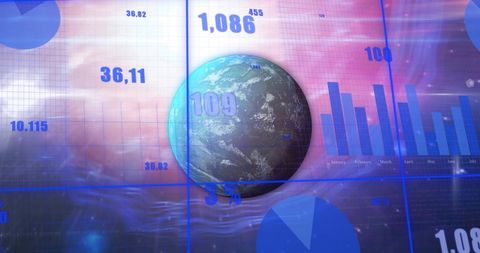
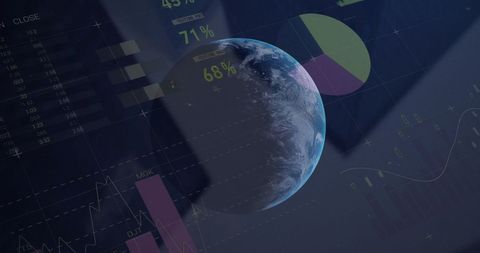
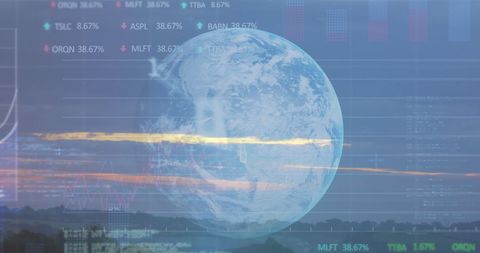
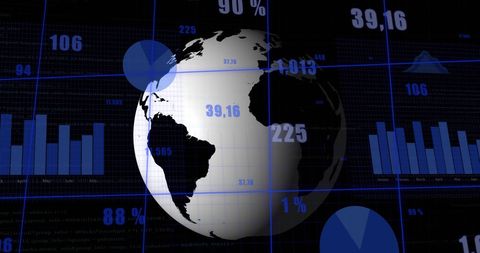
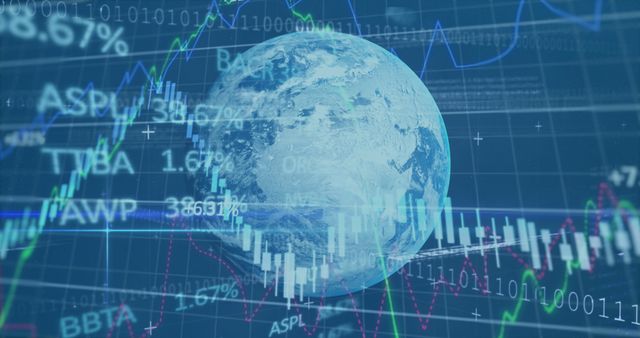
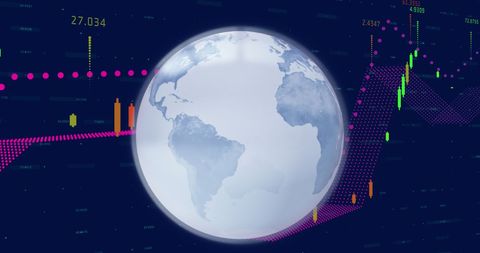
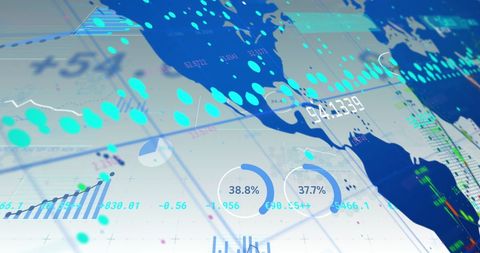
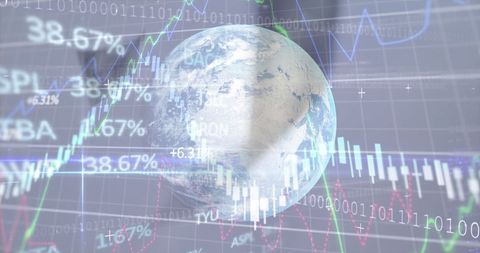
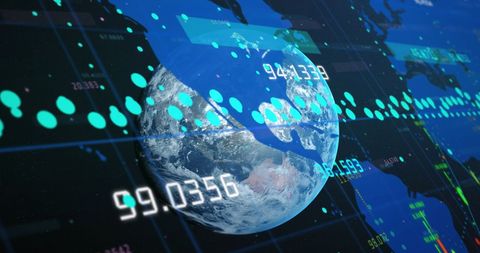
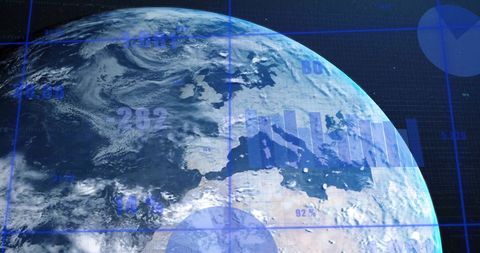
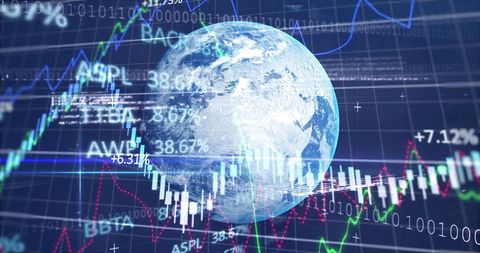
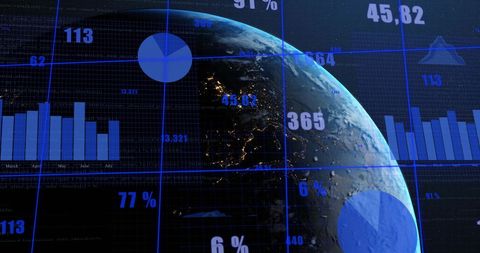
- Global Finance Visualization with Graphs and Digital Interface
Global Finance Visualization with Graphs and Digital Interface Image
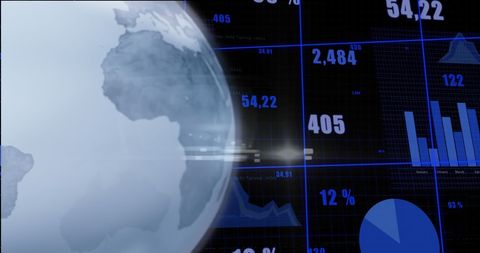
Depicts a digital interface merging earth imagery with graphs and statistics. Useful for content on global finance trends, financial marketplaces, or educational resources on economic analysis and data insights.
Powered by 


downloads
Tags:
More
Credit Photo
If you would like to credit the Photo, here are some ways you can do so
Text Link
photo Link
<span class="text-link">
<span>
<a target="_blank" href=https://pikwizard.com/photo/global-finance-visualization-with-graphs-and-digital-interface/5396140611e449847cd2e72bb129ac59/>PikWizard</a>
</span>
</span>
<span class="image-link">
<span
style="margin: 0 0 20px 0; display: inline-block; vertical-align: middle; width: 100%;"
>
<a
target="_blank"
href="https://pikwizard.com/photo/global-finance-visualization-with-graphs-and-digital-interface/5396140611e449847cd2e72bb129ac59/"
style="text-decoration: none; font-size: 10px; margin: 0;"
>
<img src="https://pikwizard.com/pw/medium/5396140611e449847cd2e72bb129ac59.jpg" style="margin: 0; width: 100%;" alt="" />
<p style="font-size: 12px; margin: 0;">PikWizard</p>
</a>
</span>
</span>
Free (free of charge)
Free for personal and commercial use.
Author: People Creations
Similar Free Stock Images
Premium


Premium


Premium


Premium

Premium


Premium


Premium

Premium


Premium


Premium


Premium


Premium


Premium


Premium

Premium


Premium


Premium


Premium


Premium


Premium


Premium


Premium


Premium


Premium


Premium

Explore More Free Stock Images