- Home >
- Stock Photos >
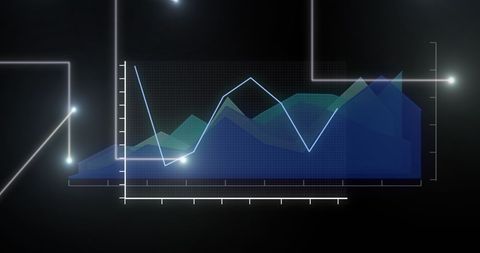
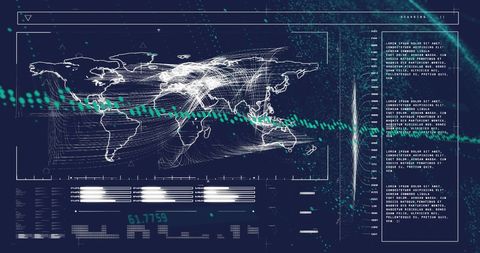
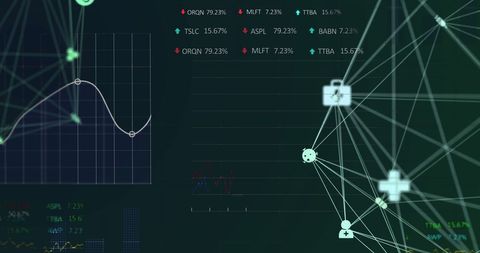
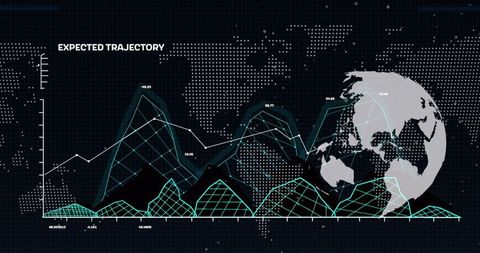
- Global Finances and Data Processing With World Map Background
Global Finances and Data Processing With World Map Background Image

Digital display with financial data processing, graph indicating upward trends on turquoise background overlaid on dotted world map. Suitable for themes involving global business trends, economic analysis, or financial technology initiatives. Useful for presentations, business reports, or digital UI design showcasing data-driven financial forecasting.

downloads
Tags:
More
Credit Photo
If you would like to credit the Photo, here are some ways you can do so
Text Link
photo Link
<span class="text-link">
<span>
<a target="_blank" href=https://pikwizard.com/photo/global-finances-and-data-processing-with-world-map-background/a5fbaba19f253488c2bf0c8c15bb2efd/>PikWizard</a>
</span>
</span>
<span class="image-link">
<span
style="margin: 0 0 20px 0; display: inline-block; vertical-align: middle; width: 100%;"
>
<a
target="_blank"
href="https://pikwizard.com/photo/global-finances-and-data-processing-with-world-map-background/a5fbaba19f253488c2bf0c8c15bb2efd/"
style="text-decoration: none; font-size: 10px; margin: 0;"
>
<img src="https://pikwizard.com/pw/medium/a5fbaba19f253488c2bf0c8c15bb2efd.jpg" style="margin: 0; width: 100%;" alt="" />
<p style="font-size: 12px; margin: 0;">PikWizard</p>
</a>
</span>
</span>
Free (free of charge)
Free for personal and commercial use.
Author: Creative Art