
- Home >
- Stock Photos >
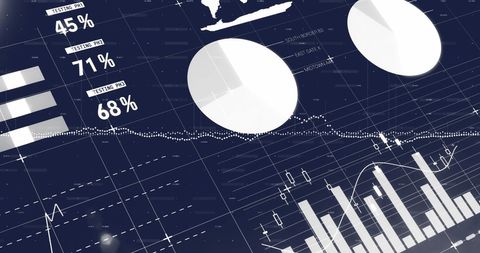
- Global Financial Analysis Chart with Data Visualization
Global Financial Analysis Chart with Data Visualization Image

Provides insight into global data processing and analytical finance trends. Ideal for illustrating financial reports, presentations on market analytics, economic studies, technology blogs, and articles discussing international business strategies.
Powered by 


downloads
Tags:
More
Credit Photo
If you would like to credit the Photo, here are some ways you can do so
Text Link
photo Link
<span class="text-link">
<span>
<a target="_blank" href=https://pikwizard.com/photo/global-financial-analysis-chart-with-data-visualization/7d8ceaf77cade6f7ee314f6531e35055/>PikWizard</a>
</span>
</span>
<span class="image-link">
<span
style="margin: 0 0 20px 0; display: inline-block; vertical-align: middle; width: 100%;"
>
<a
target="_blank"
href="https://pikwizard.com/photo/global-financial-analysis-chart-with-data-visualization/7d8ceaf77cade6f7ee314f6531e35055/"
style="text-decoration: none; font-size: 10px; margin: 0;"
>
<img src="https://pikwizard.com/pw/medium/7d8ceaf77cade6f7ee314f6531e35055.jpg" style="margin: 0; width: 100%;" alt="" />
<p style="font-size: 12px; margin: 0;">PikWizard</p>
</a>
</span>
</span>
Free (free of charge)
Free for personal and commercial use.
Author: Creative Art
Similar Free Stock Images

Premium


Premium

Premium


Premium


Premium

Premium


Premium

Premium

Premium


Premium
Premium


Premium


Premium


Premium

Premium

Premium


Premium


Premium

Premium


Premium


Premium


Premium


Premium


Premium


Premium

Explore More Free Stock Images