
- Home >
- Stock Photos >
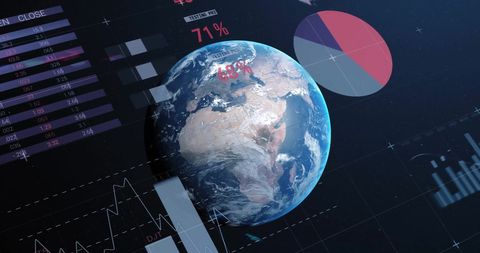
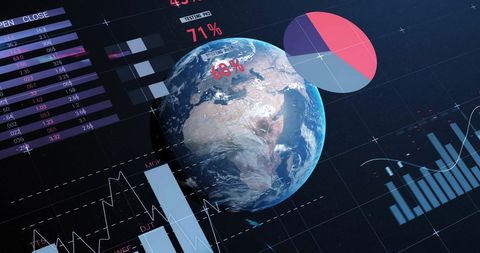
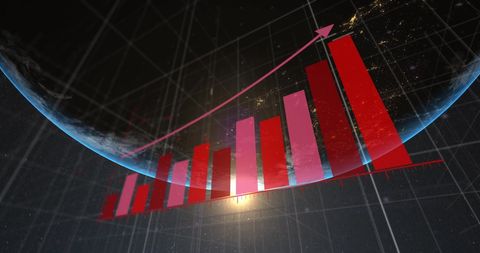
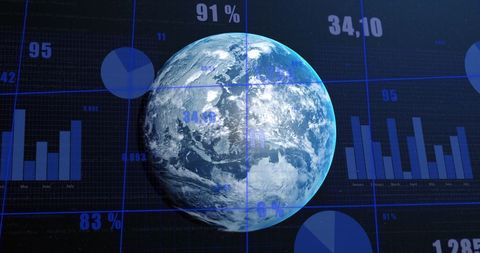
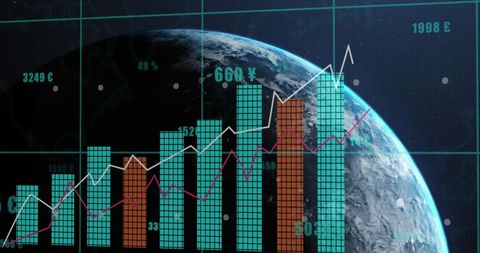
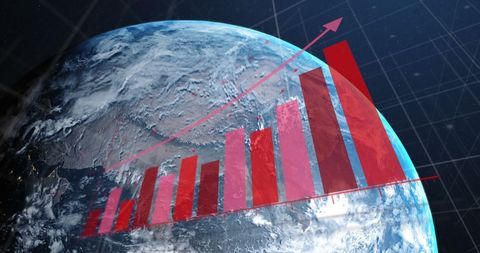
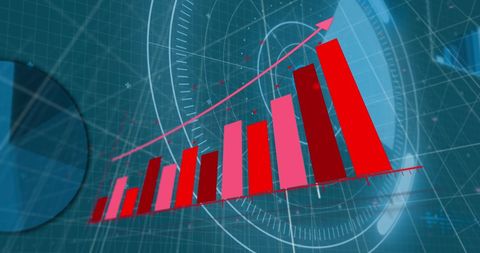
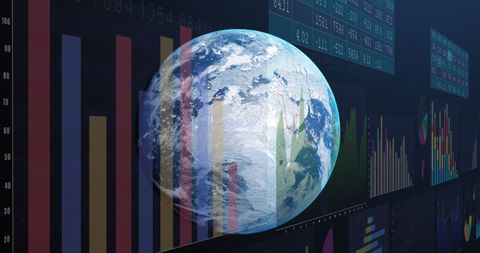
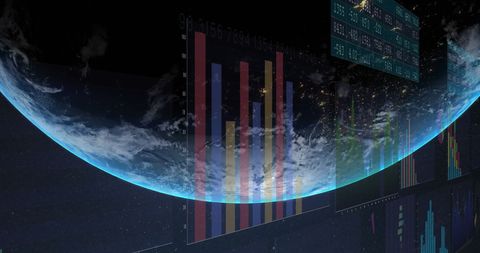
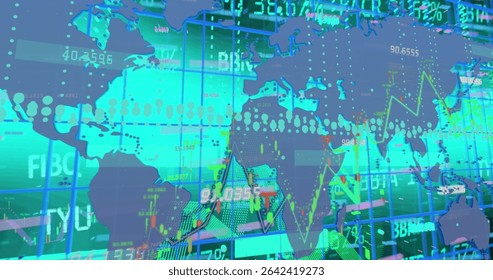
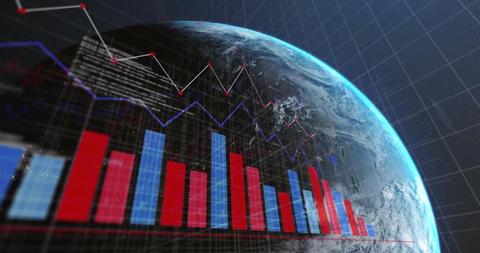
- Global Financial Analysis with Bar Graph Visualization
Global Financial Analysis with Bar Graph Visualization Image

Concept of global financial markets and data visualization with bar graphs pointing downward implying economic analysis. Useful for illustrating trends in global business, finance sector pieces, technology apps, data analytics processes or online content focused on market fluctuations.
Powered by  - Get 15% off with code: PIKWIZARD15


downloads
Tags:
More
Credit Photo
If you would like to credit the Photo, here are some ways you can do so
Text Link
photo Link
<span class="text-link">
<span>
<a target="_blank" href=https://pikwizard.com/photo/global-financial-analysis-with-bar-graph-visualization/4d11e64c6884cb855c43d07cf86ad651/>PikWizard</a>
</span>
</span>
<span class="image-link">
<span
style="margin: 0 0 20px 0; display: inline-block; vertical-align: middle; width: 100%;"
>
<a
target="_blank"
href="https://pikwizard.com/photo/global-financial-analysis-with-bar-graph-visualization/4d11e64c6884cb855c43d07cf86ad651/"
style="text-decoration: none; font-size: 10px; margin: 0;"
>
<img src="https://pikwizard.com/pw/medium/4d11e64c6884cb855c43d07cf86ad651.jpg" style="margin: 0; width: 100%;" alt="" />
<p style="font-size: 12px; margin: 0;">PikWizard</p>
</a>
</span>
</span>
Free (free of charge)
Free for personal and commercial use.
Author: People Creations
Similar Free Stock Images

Premium


Premium


Premium


Premium

Premium

Premium

Premium


Premium

Premium


Premium


Premium


Premium

Premium


Premium


Premium


Premium

Premium

Premium


Premium


Premium


Premium


Premium

Premium

Premium


Premium


Explore More Free Stock Images