- Home >
- Stock Photos >
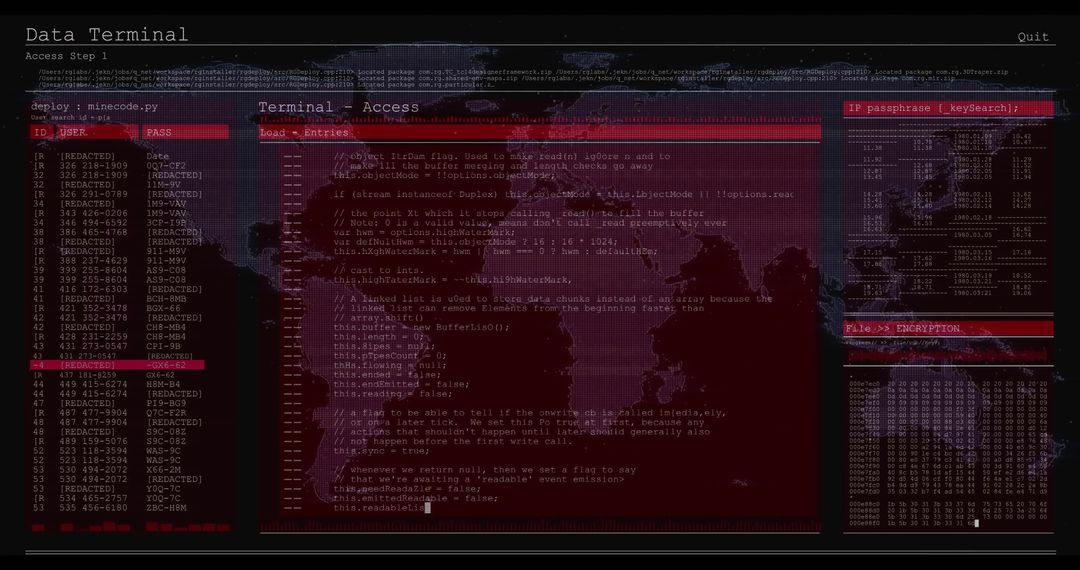
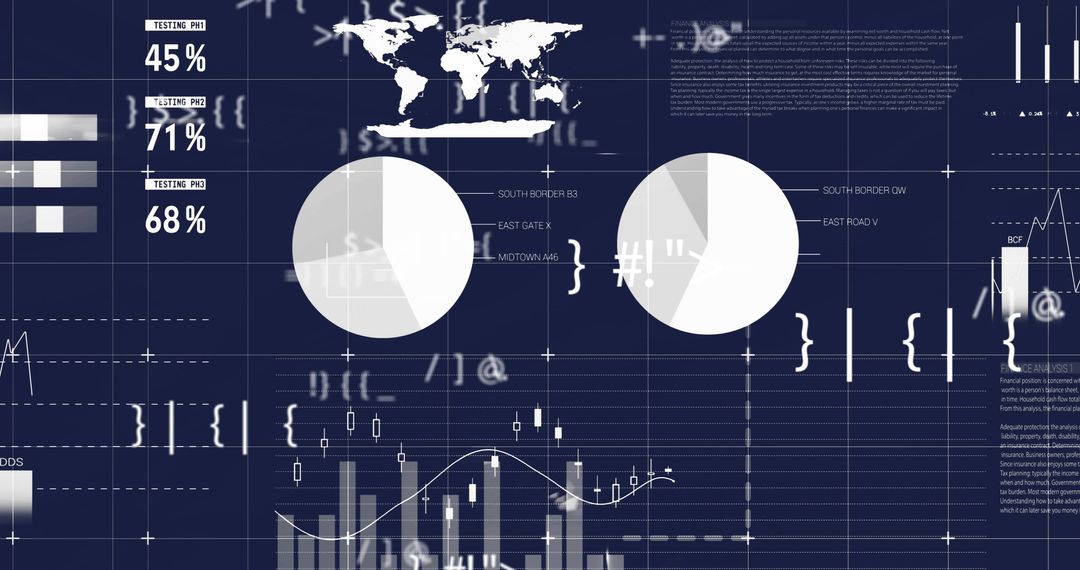
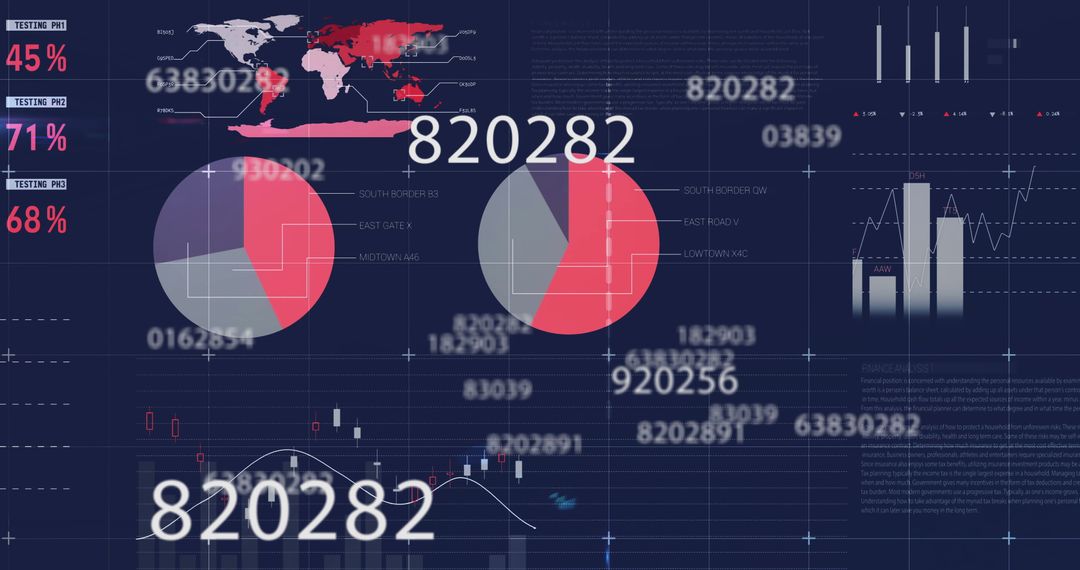
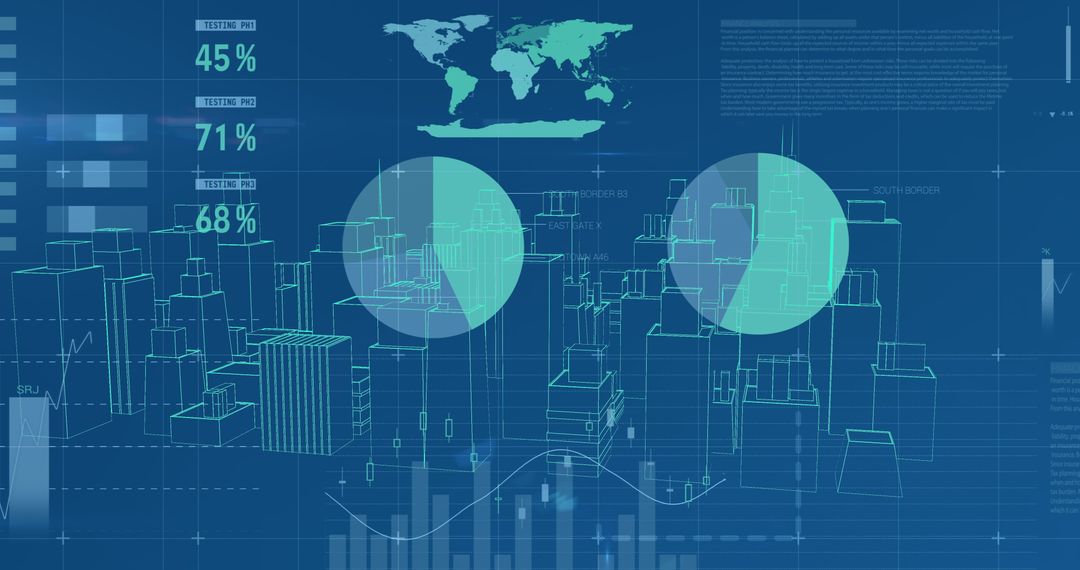
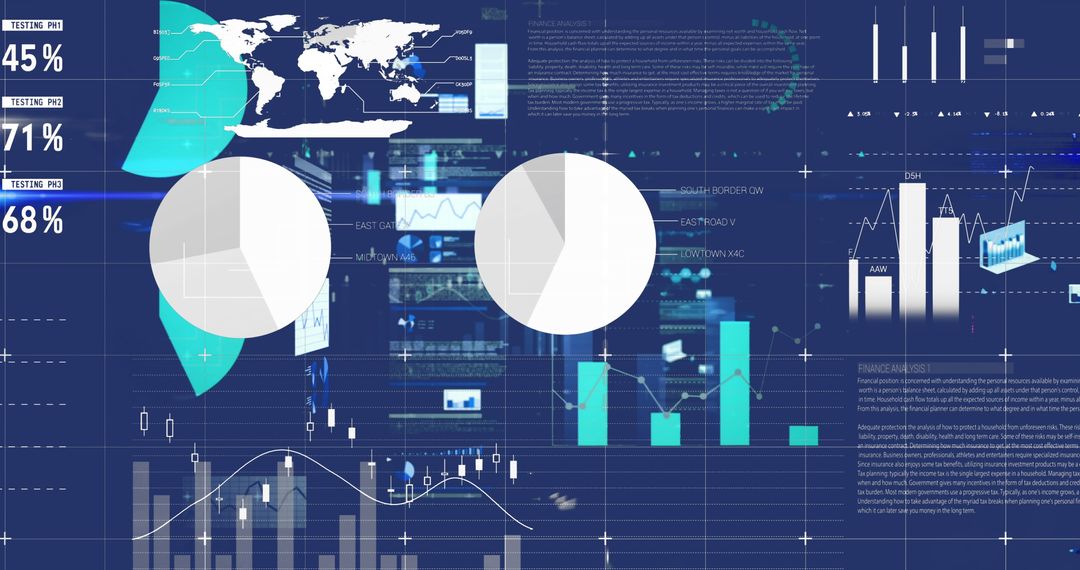
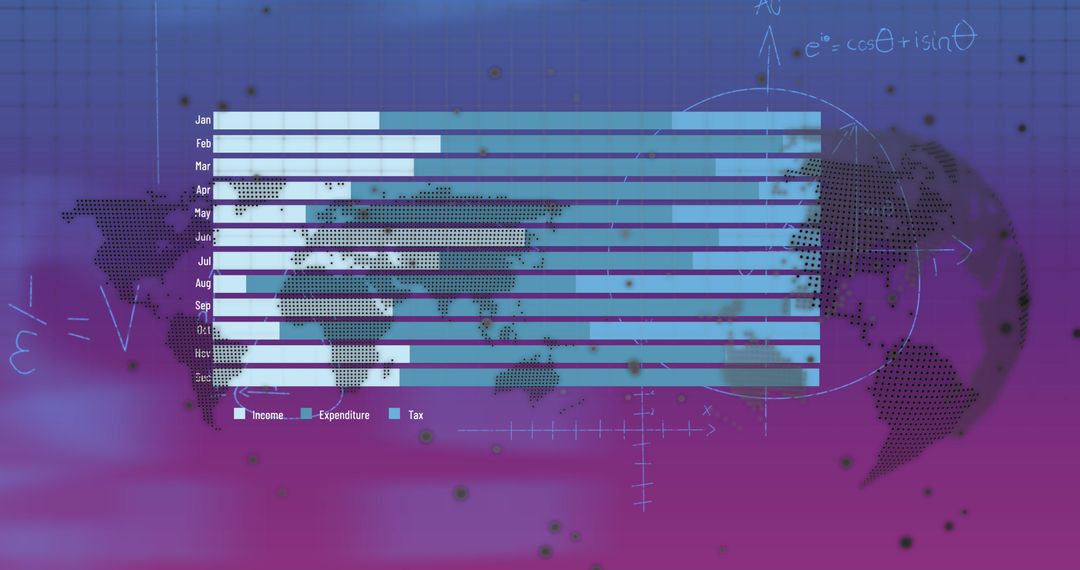
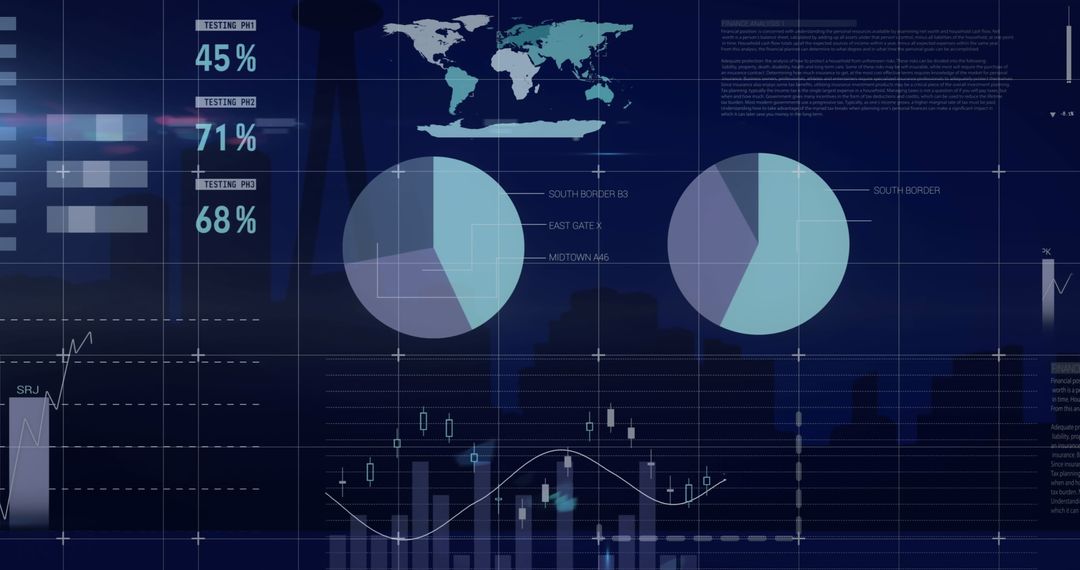
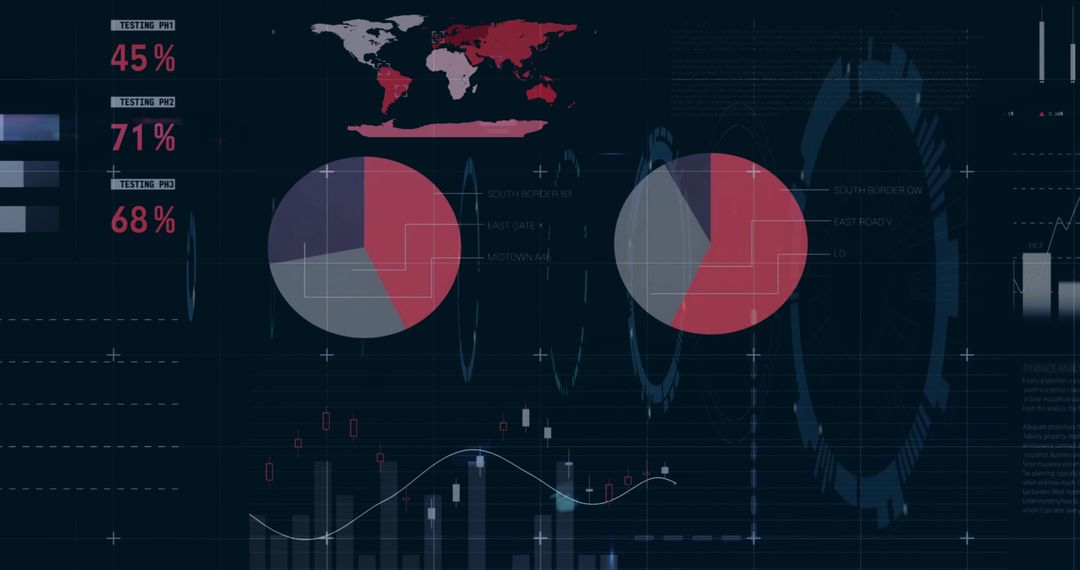
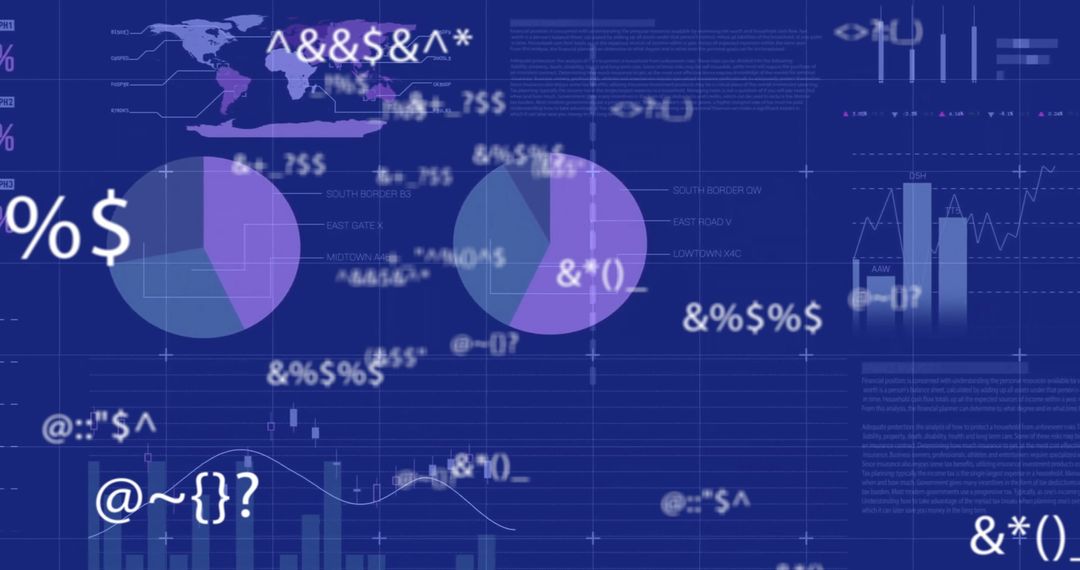
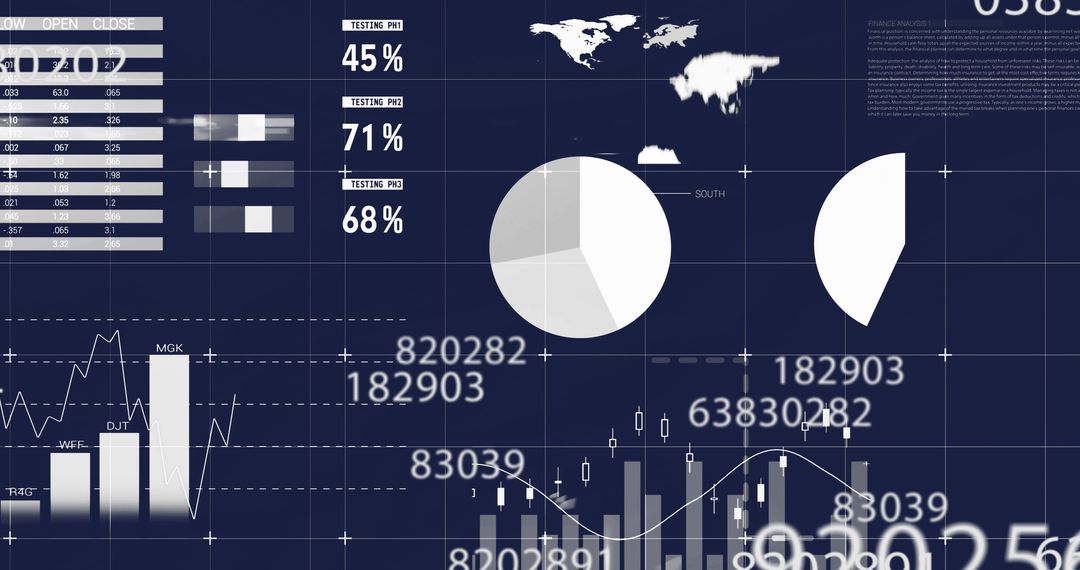
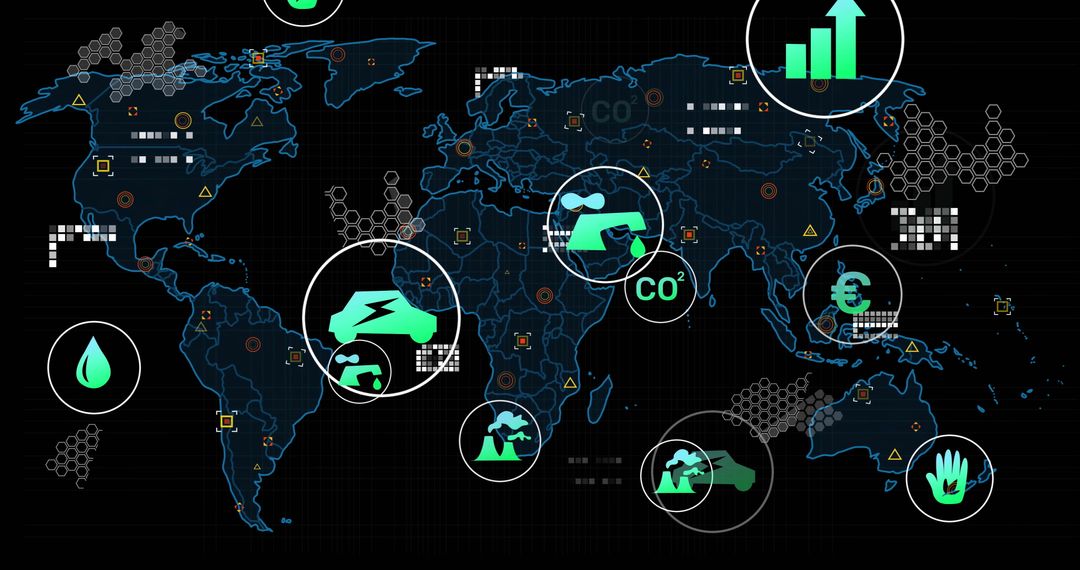
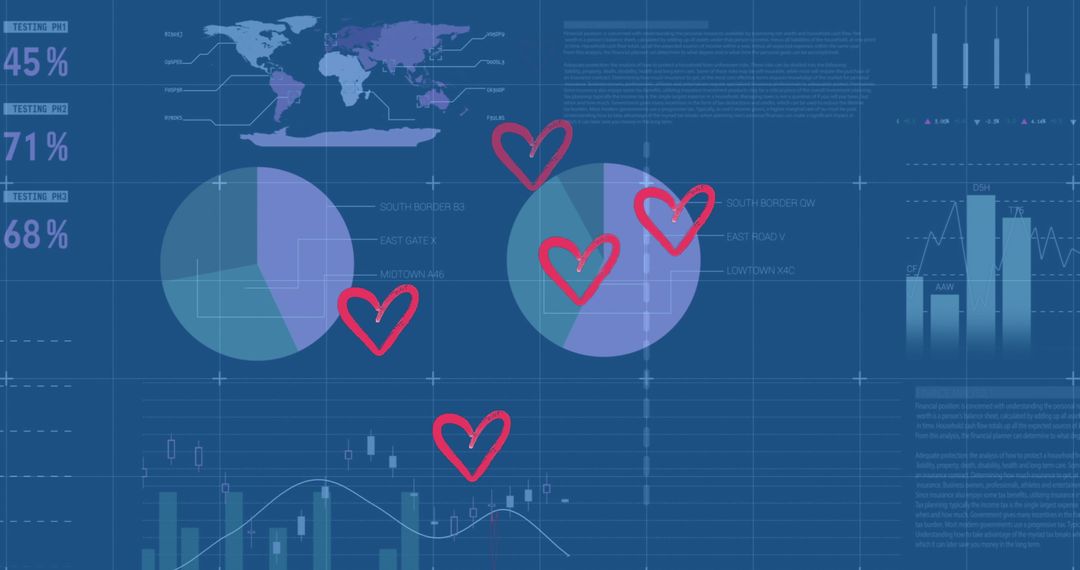
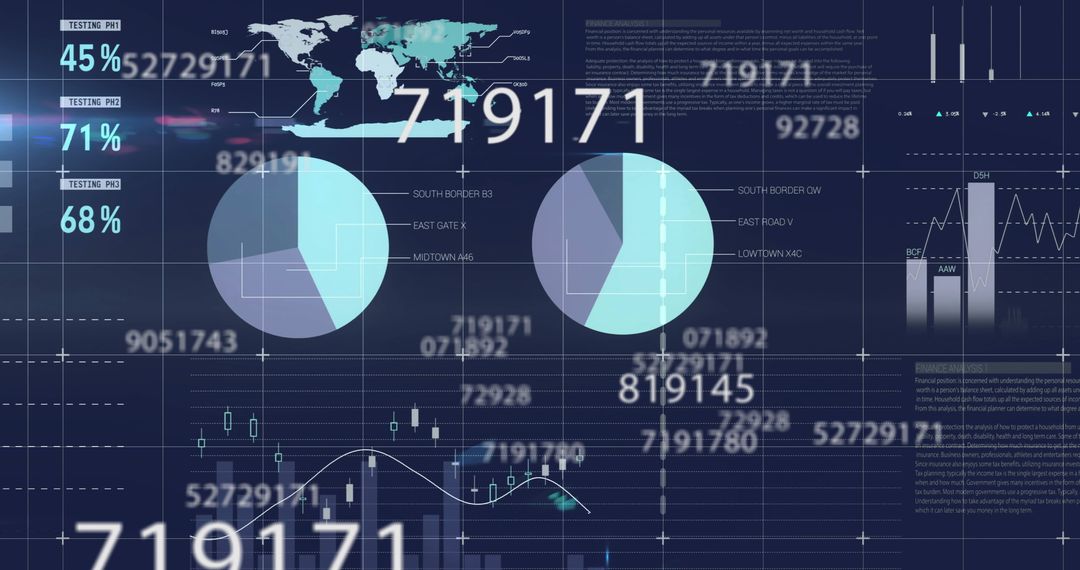
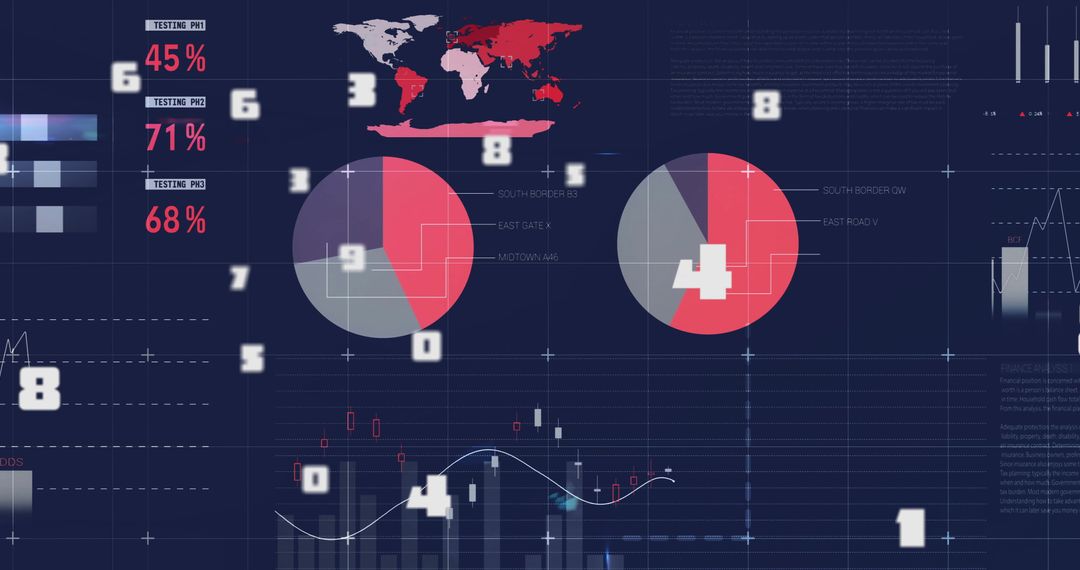
- Global Financial Analytics with Data Charts and Graphs
Global Financial Analytics with Data Charts and Graphs Image
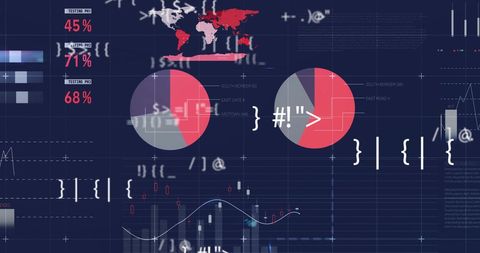
Visual representation of global financial analytics with integrated charts and graphs overlaid on a world map. Useful for illustrating concepts related to global commerce, statistical analysis in finance, international market trends, and technological decision-making processes. Ideal for use in presentations, finance websites, and educational materials related to business and analytics.
Powered by 


0
downloads
downloads
Tags:
More
Credit Photo
If you would like to credit the Photo, here are some ways you can do so
Text Link
photo Link
<span class="text-link">
<span>
<a target="_blank" href=https://pikwizard.com/photo/global-financial-analytics-with-data-charts-and-graphs/d82a9d9542f51ce26e1a50d475e71676/>PikWizard</a>
</span>
</span>
<span class="image-link">
<span
style="margin: 0 0 20px 0; display: inline-block; vertical-align: middle; width: 100%;"
>
<a
target="_blank"
href="https://pikwizard.com/photo/global-financial-analytics-with-data-charts-and-graphs/d82a9d9542f51ce26e1a50d475e71676/"
style="text-decoration: none; font-size: 10px; margin: 0;"
>
<img src="https://pikwizard.com/pw/medium/d82a9d9542f51ce26e1a50d475e71676.jpg" style="margin: 0; width: 100%;" alt="" />
<p style="font-size: 12px; margin: 0;">PikWizard</p>
</a>
</span>
</span>
Free (free of charge)
Free for personal and commercial use.
Author: People Creations
Similar Free Stock Images

Premium


Premium


Premium


Premium


Premium


Premium


Premium


Premium


Premium


Premium

Premium


Premium


Premium


Premium


Premium


Premium


Premium

Premium


Premium


Premium


Premium

Premium

Premium


Premium