
- Home >
- Stock Photos >
- Global Financial Analytics with Interactive Data Visualization
Global Financial Analytics with Interactive Data Visualization Image

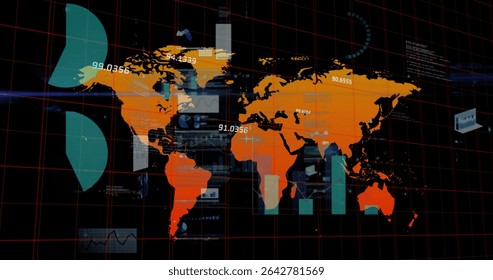
Technological concept depicting global financial analytics and data visualization overlaid on world map with interactive elements such as graphs and numbers. Suitable for illustrating financial reports, technological analyses, and global business solutions in presentations and media.
Powered by  - Get 15% off with code: PIKWIZARD15


downloads
Tags:
More
Credit Photo
If you would like to credit the Photo, here are some ways you can do so
Text Link
photo Link
<span class="text-link">
<span>
<a target="_blank" href=https://pikwizard.com/photo/global-financial-analytics-with-interactive-data-visualization/1763b972ca521867ef1fc1b1d665ad95/>PikWizard</a>
</span>
</span>
<span class="image-link">
<span
style="margin: 0 0 20px 0; display: inline-block; vertical-align: middle; width: 100%;"
>
<a
target="_blank"
href="https://pikwizard.com/photo/global-financial-analytics-with-interactive-data-visualization/1763b972ca521867ef1fc1b1d665ad95/"
style="text-decoration: none; font-size: 10px; margin: 0;"
>
<img src="https://pikwizard.com/pw/medium/1763b972ca521867ef1fc1b1d665ad95.jpg" style="margin: 0; width: 100%;" alt="" />
<p style="font-size: 12px; margin: 0;">PikWizard</p>
</a>
</span>
</span>
Free (free of charge)
Free for personal and commercial use.
Author: Awesome Content