- Home >
- Stock Photos >
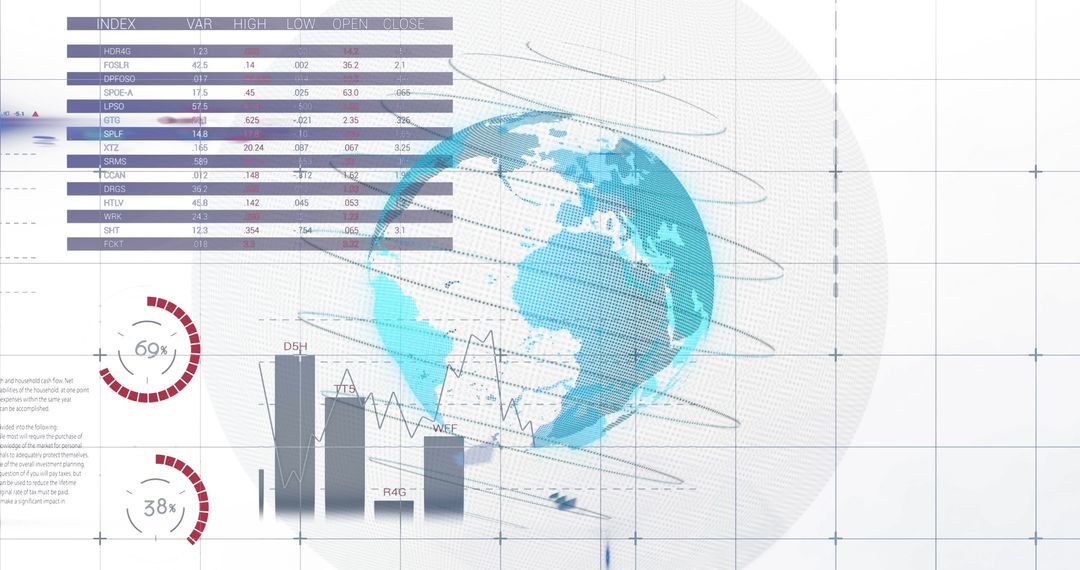
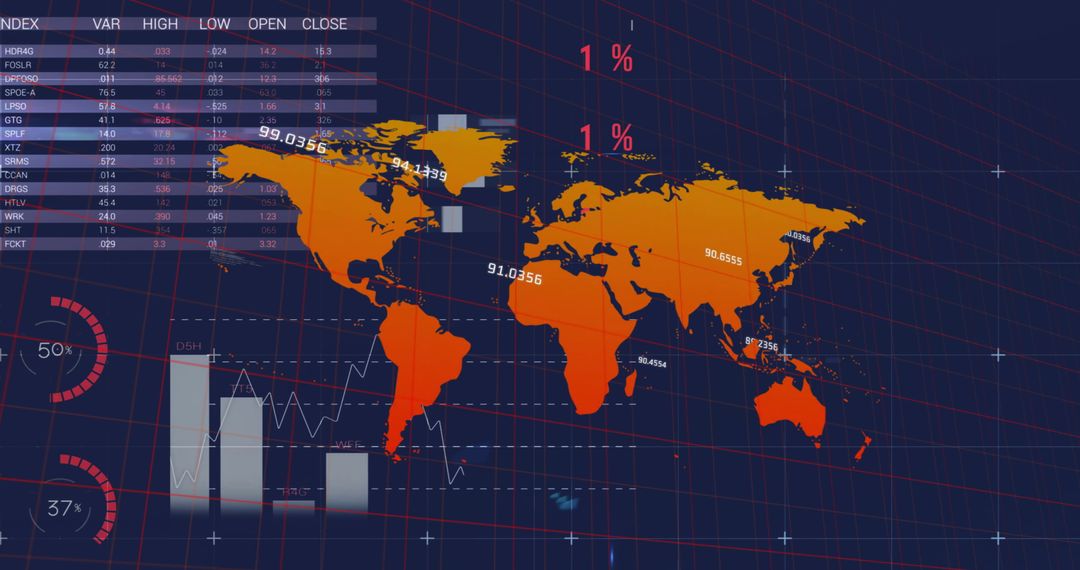
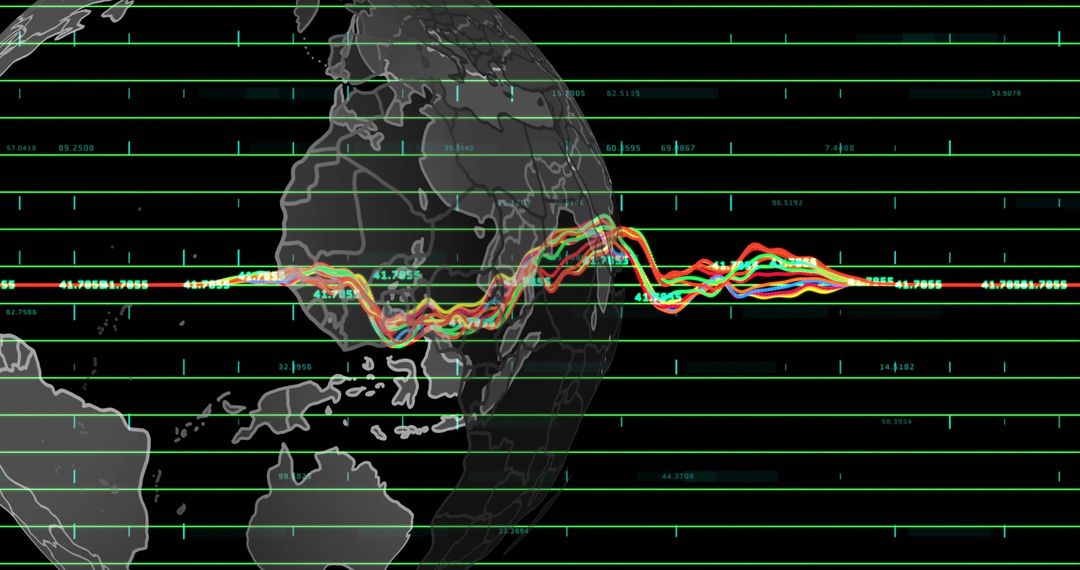
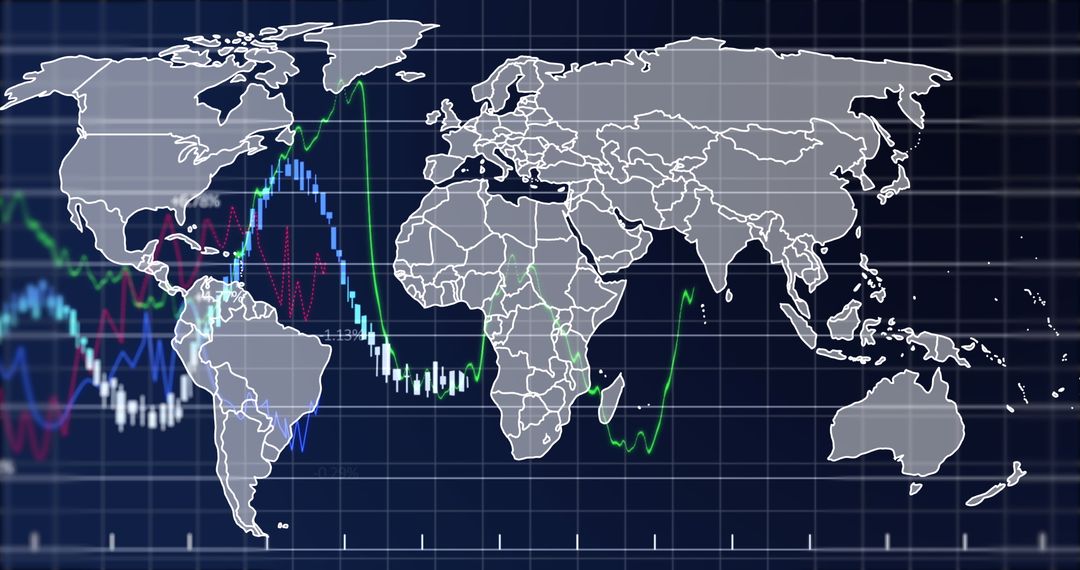
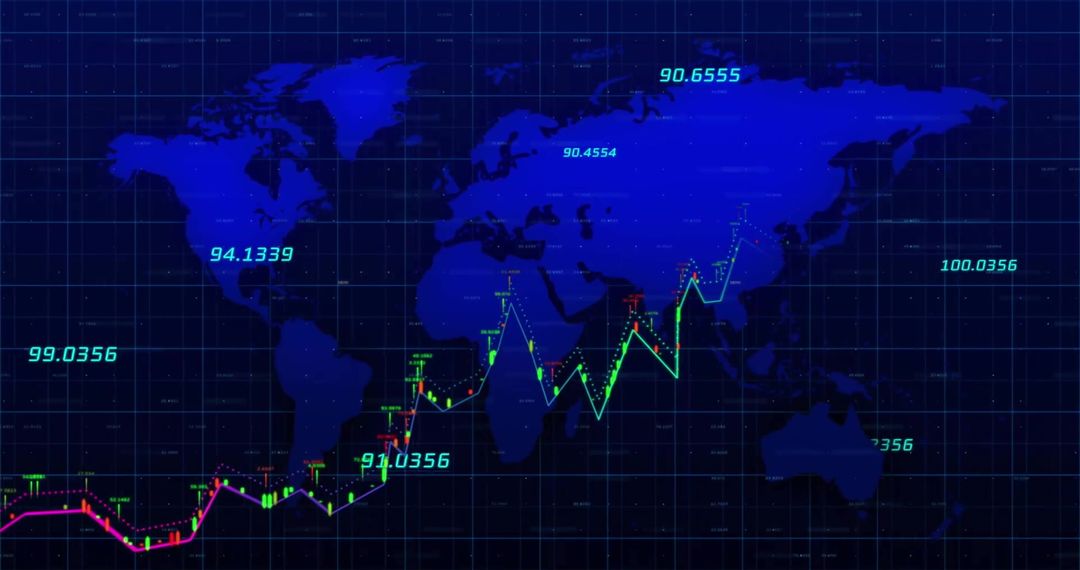
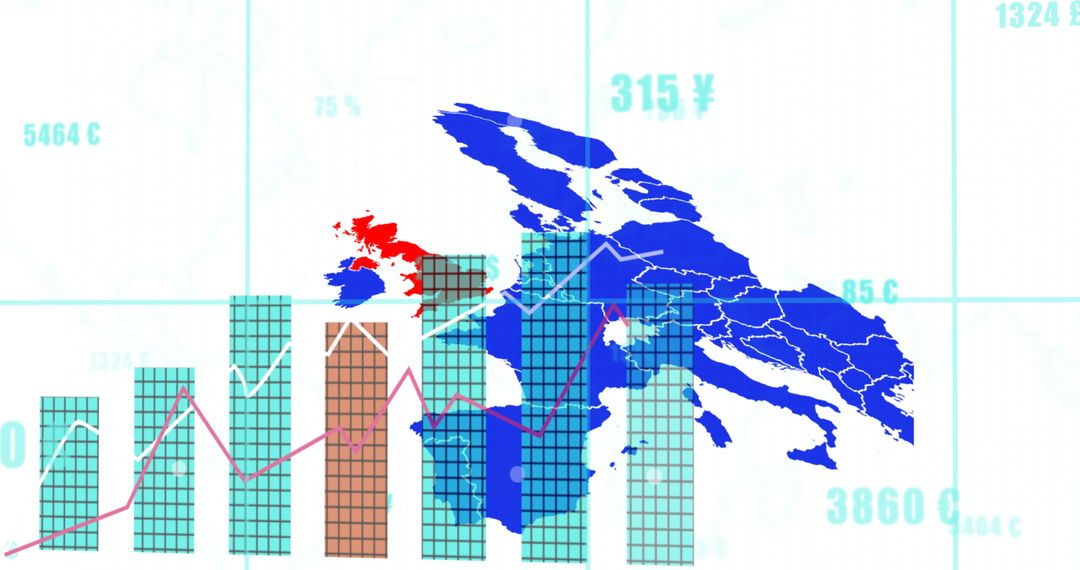
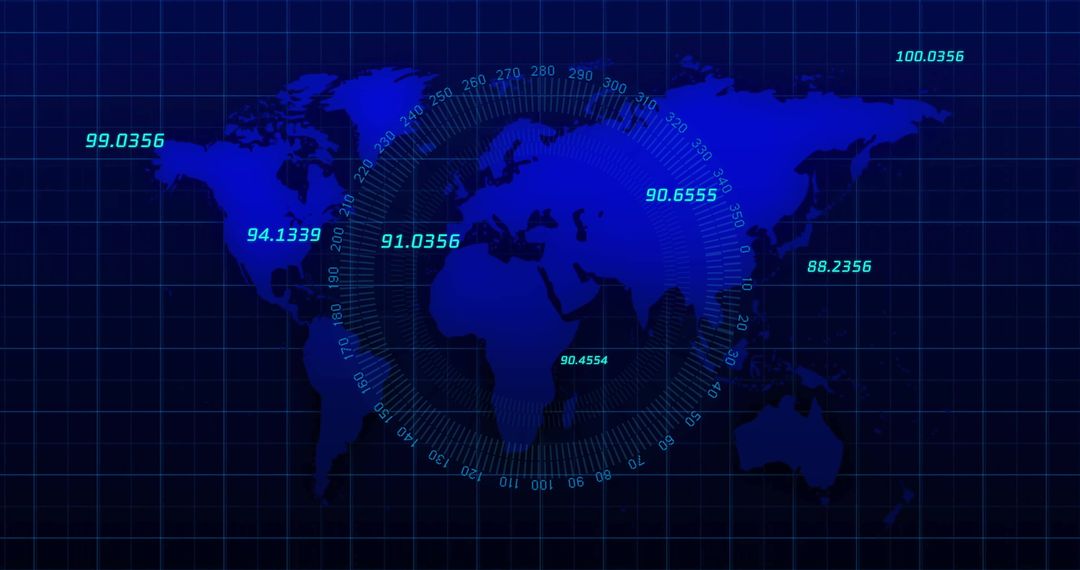
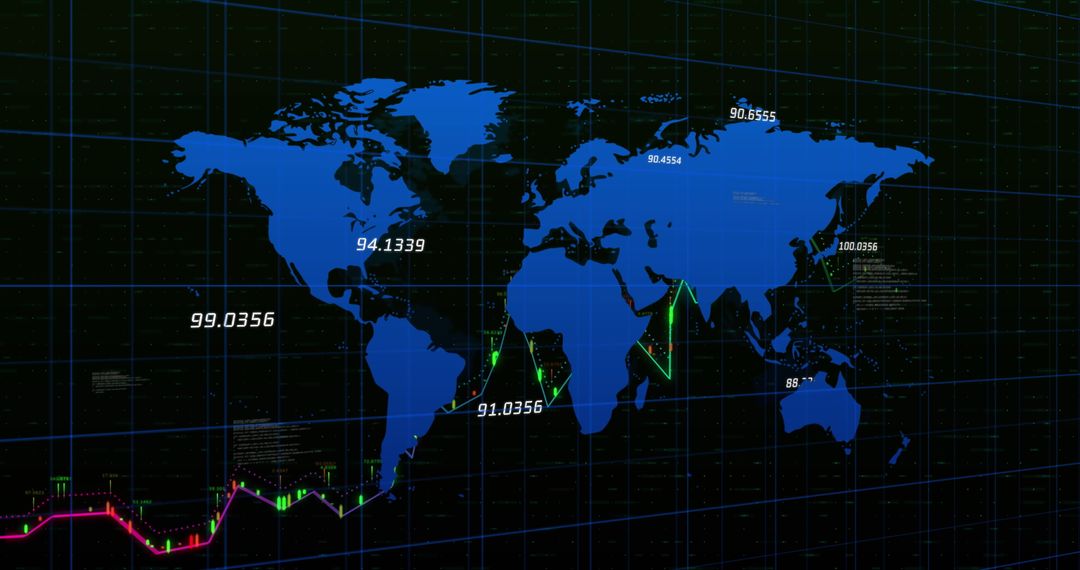
- Global Financial Dashboard with Charts and World Map
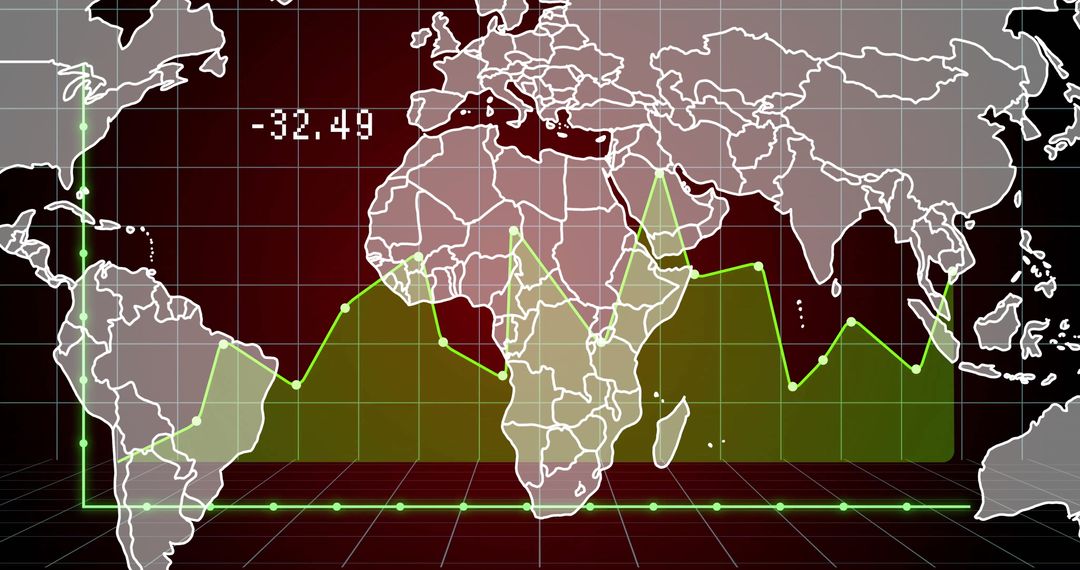
Global Financial Dashboard with Charts and World Map Image
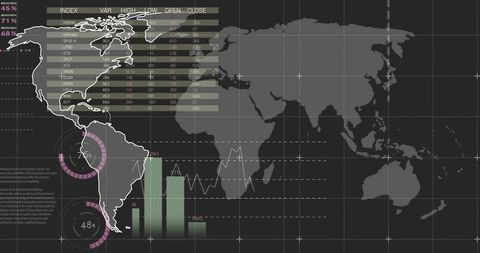
Display captures global financial data dashboard with interactive charts and graphs overlaying a world map. Useful for conveying data visualization themes in modern finance, technological economics or digital investment analysis contexts. Ideal for articles or presentations focusing on global financial metrics, technological impacts in econometrics or modern data analytics tools.
Powered by  - Get 15% off with code: PIKWIZARD15


0
downloads
downloads
Tags:
More
Credit Photo
If you would like to credit the Photo, here are some ways you can do so
Text Link
photo Link
<span class="text-link">
<span>
<a target="_blank" href=https://pikwizard.com/photo/global-financial-dashboard-with-charts-and-world-map/67a051def3d4050418fee90716941e77/>PikWizard</a>
</span>
</span>
<span class="image-link">
<span
style="margin: 0 0 20px 0; display: inline-block; vertical-align: middle; width: 100%;"
>
<a
target="_blank"
href="https://pikwizard.com/photo/global-financial-dashboard-with-charts-and-world-map/67a051def3d4050418fee90716941e77/"
style="text-decoration: none; font-size: 10px; margin: 0;"
>
<img src="https://pikwizard.com/pw/medium/67a051def3d4050418fee90716941e77.jpg" style="margin: 0; width: 100%;" alt="" />
<p style="font-size: 12px; margin: 0;">PikWizard</p>
</a>
</span>
</span>
Free (free of charge)
Free for personal and commercial use.
Author: Creative Art
Similar Free Stock Images

Premium

Premium


Premium


Premium


Premium


Premium


Premium


Premium


Premium


Premium


Premium


Premium


Premium


Premium


Premium


Premium


Premium


Premium


Premium


Premium


Premium


Premium


Premium


Premium