
- Home >
- Stock Photos >
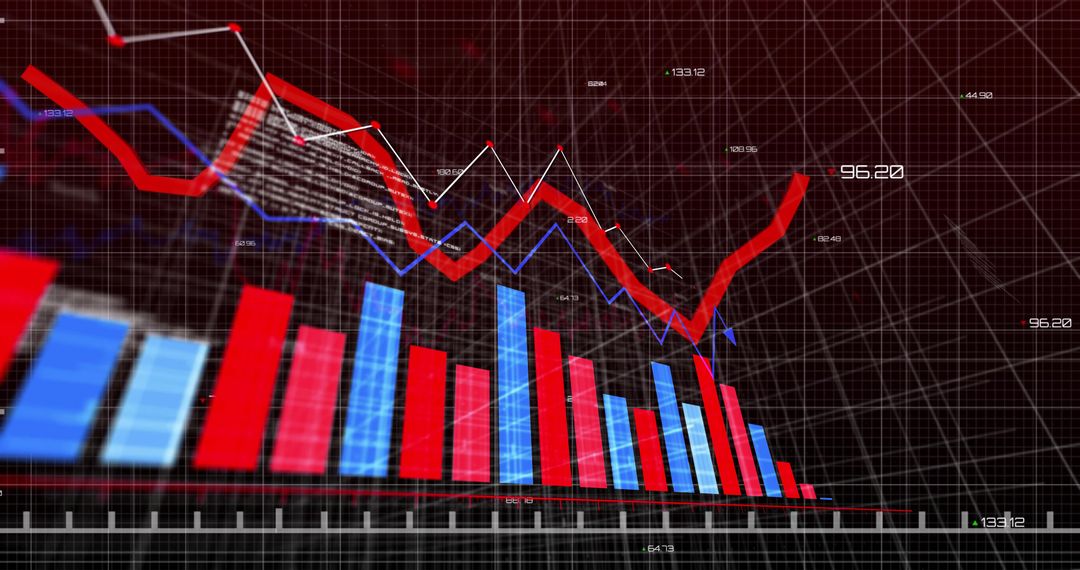
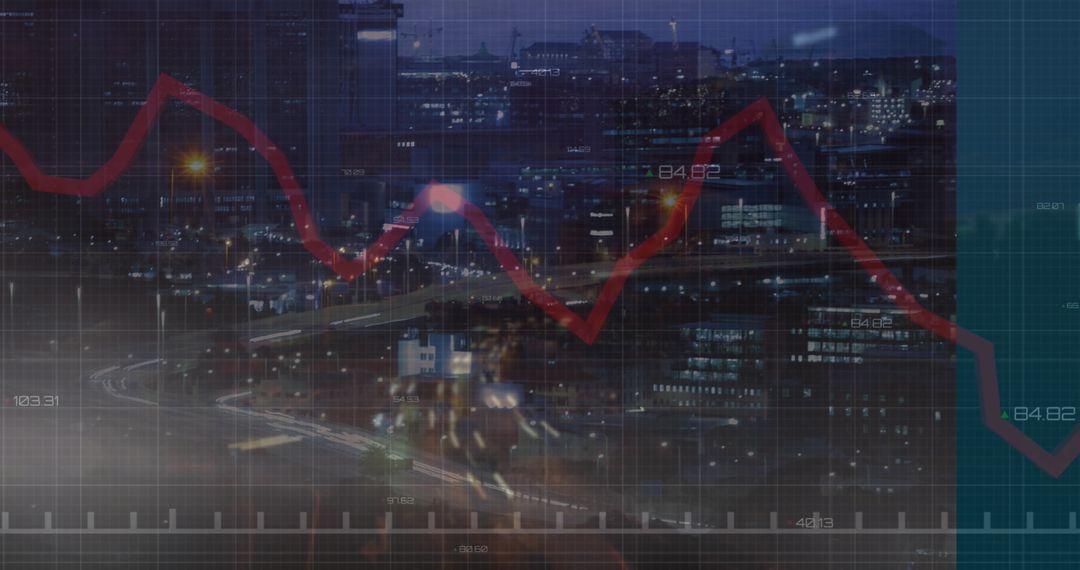
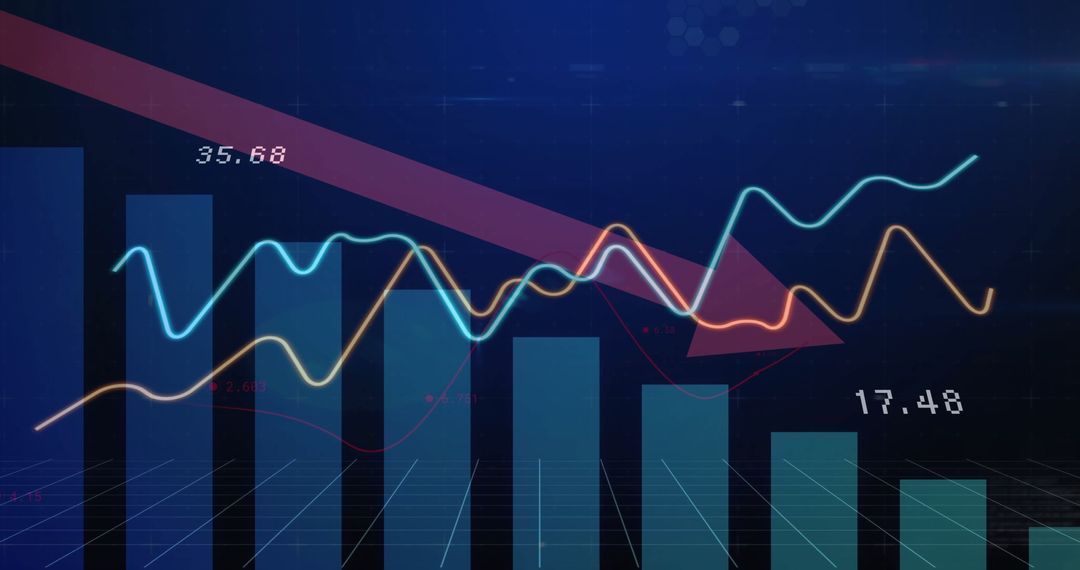
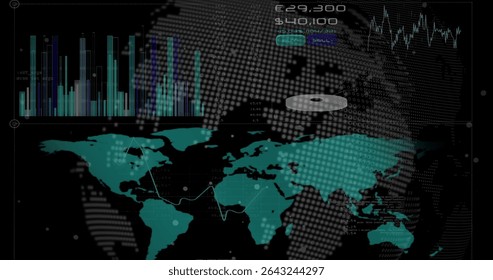
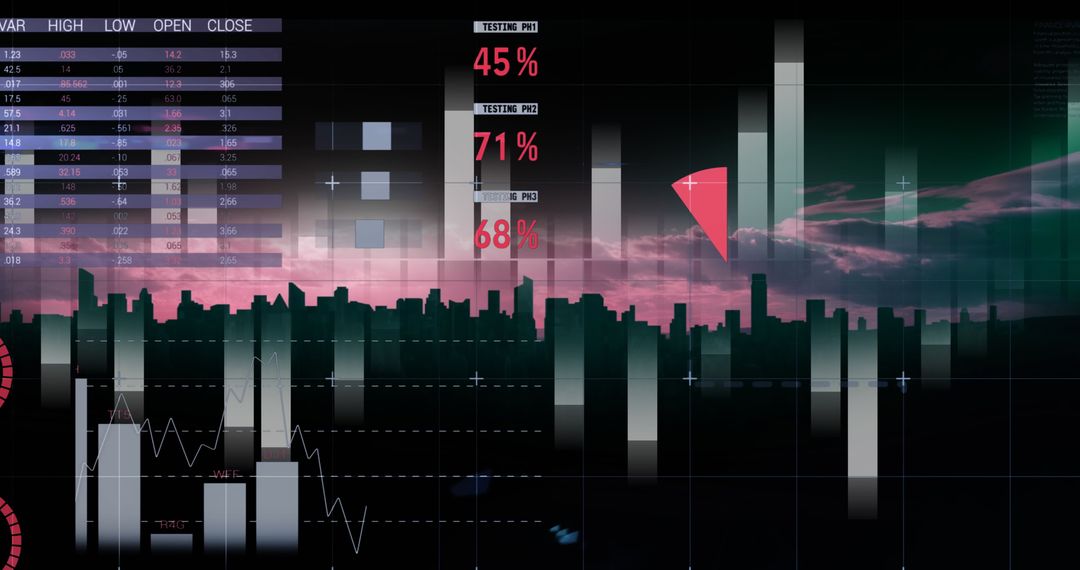
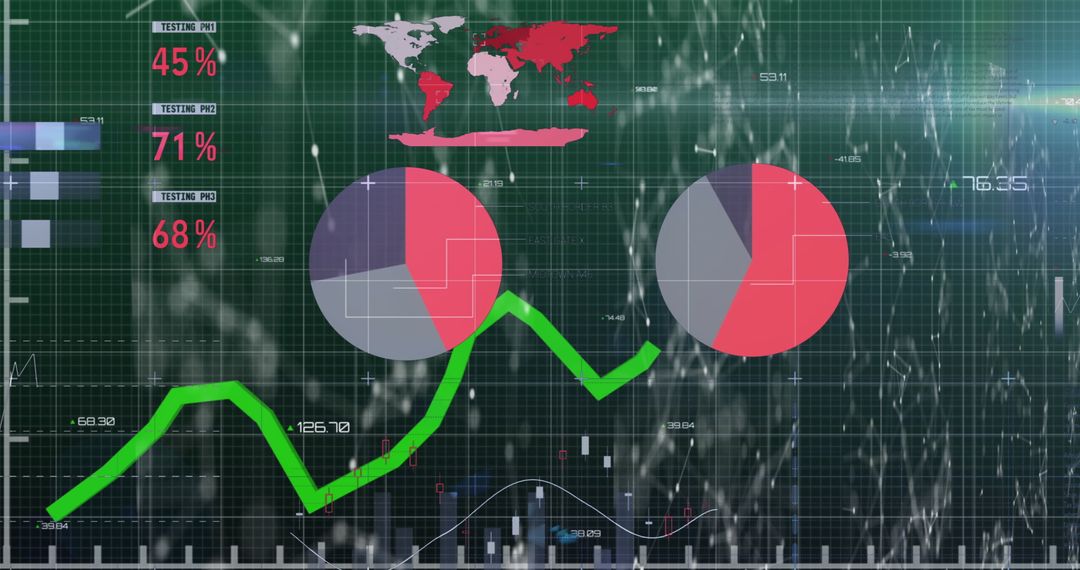
- Global Financial Dashboard with Red Downward Trend Line Graph
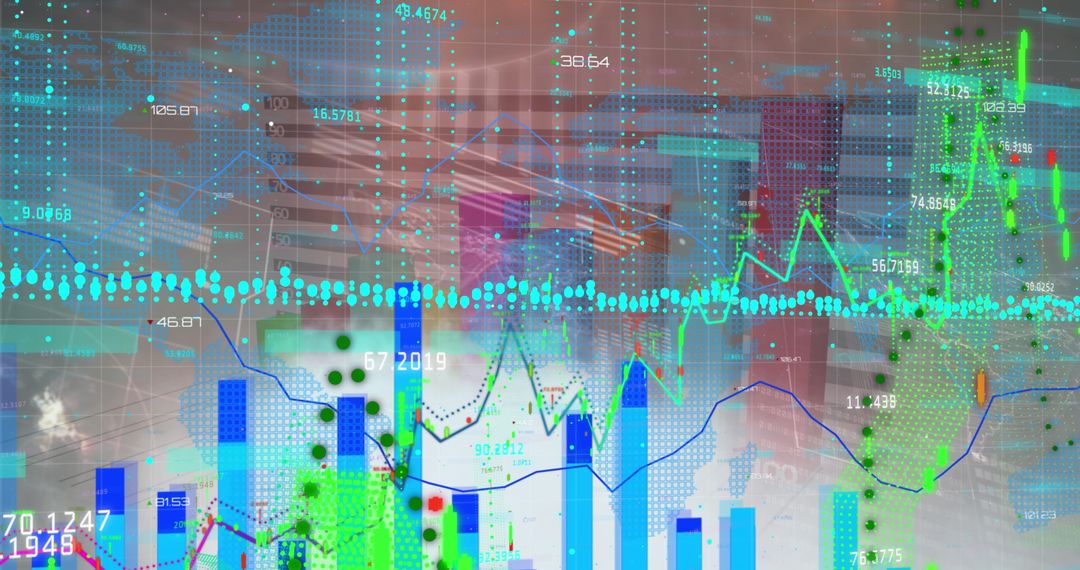
Global Financial Dashboard with Red Downward Trend Line Graph Image

The image displays a high-tech financial dashboard, featuring various analytics and graphical data aids. A red line graph indicates a downward trend against a background of digital screens. Global maps and numerical percentages add a modern and business-oriented context. This visual is useful for illustrating articles about market fluctuations, economic reports or presentations on data visualization in the finance sector. It is ideal for conveying the challenges or analysis of financial markets and trends in contemporary global economies.
Powered by  - Get 15% off with code: PIKWIZARD15


0
downloads
downloads
Tags:
More
Credit Photo
If you would like to credit the Photo, here are some ways you can do so
Text Link
photo Link
<span class="text-link">
<span>
<a target="_blank" href=https://pikwizard.com/photo/global-financial-dashboard-with-red-downward-trend-line-graph/4637e1a353a5d1b71f55ed30f465bd9f/>PikWizard</a>
</span>
</span>
<span class="image-link">
<span
style="margin: 0 0 20px 0; display: inline-block; vertical-align: middle; width: 100%;"
>
<a
target="_blank"
href="https://pikwizard.com/photo/global-financial-dashboard-with-red-downward-trend-line-graph/4637e1a353a5d1b71f55ed30f465bd9f/"
style="text-decoration: none; font-size: 10px; margin: 0;"
>
<img src="https://pikwizard.com/pw/medium/4637e1a353a5d1b71f55ed30f465bd9f.jpg" style="margin: 0; width: 100%;" alt="" />
<p style="font-size: 12px; margin: 0;">PikWizard</p>
</a>
</span>
</span>
Free (free of charge)
Free for personal and commercial use.
Author: Awesome Content
Similar Free Stock Images

Premium


Premium


Premium


Premium


Premium


Premium


Premium


Premium


Premium


Premium


Premium


Premium


Premium


Premium


Premium


Premium


Premium


Premium


Premium


Premium


Premium


Premium


Premium


Premium

