
- Home >
- Stock Photos >
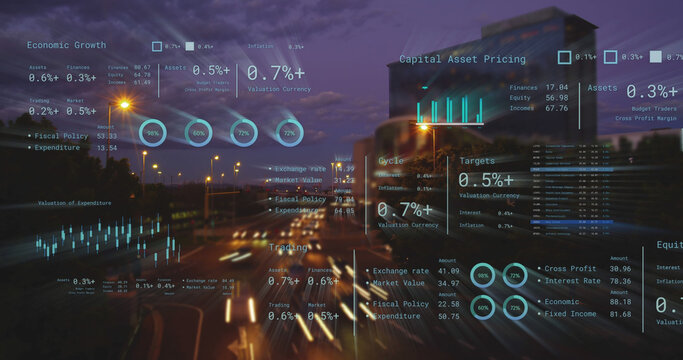
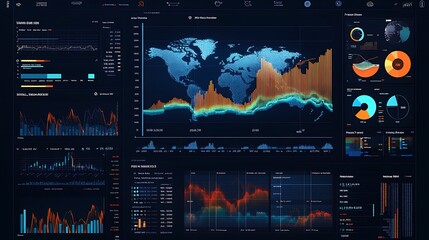
- Global Financial Data Analysis and Visualization Concept
Global Financial Data Analysis and Visualization Concept Image

Abstract representation of global financial analysis shows various charts and graphs. Useful in presentations or articles on business analytics, economic trends, data science, and digital finance. Ideal for visual content relating to stock markets, financial services, and corporate data analysis projects.
Powered by 


downloads
Tags:
More
Credit Photo
If you would like to credit the Photo, here are some ways you can do so
Text Link
photo Link
<span class="text-link">
<span>
<a target="_blank" href=https://pikwizard.com/photo/global-financial-data-analysis-and-visualization-concept/bea780c9a1e34d9dff5ef27b4dd3caf5/>PikWizard</a>
</span>
</span>
<span class="image-link">
<span
style="margin: 0 0 20px 0; display: inline-block; vertical-align: middle; width: 100%;"
>
<a
target="_blank"
href="https://pikwizard.com/photo/global-financial-data-analysis-and-visualization-concept/bea780c9a1e34d9dff5ef27b4dd3caf5/"
style="text-decoration: none; font-size: 10px; margin: 0;"
>
<img src="https://pikwizard.com/pw/medium/bea780c9a1e34d9dff5ef27b4dd3caf5.jpg" style="margin: 0; width: 100%;" alt="" />
<p style="font-size: 12px; margin: 0;">PikWizard</p>
</a>
</span>
</span>
Free (free of charge)
Free for personal and commercial use.
Author: Awesome Content
Similar Free Stock Images

Premium


Premium

Premium


Premium


Premium


Premium


Premium


Premium


Premium


Premium


Premium


Premium

Premium

Premium


Premium


Premium


Premium


Premium


Premium


Premium


Premium

Premium


Premium

Premium


Premium


Explore More Free Stock Images