- Home >
- Stock Photos >
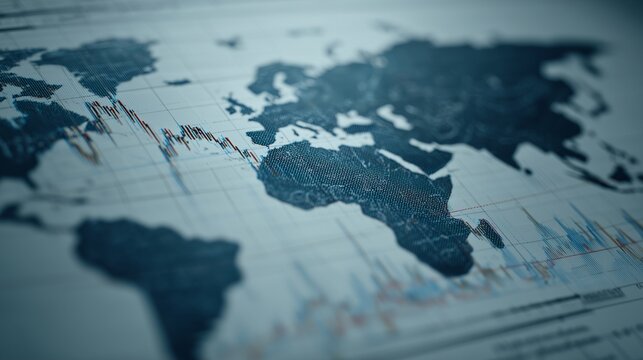
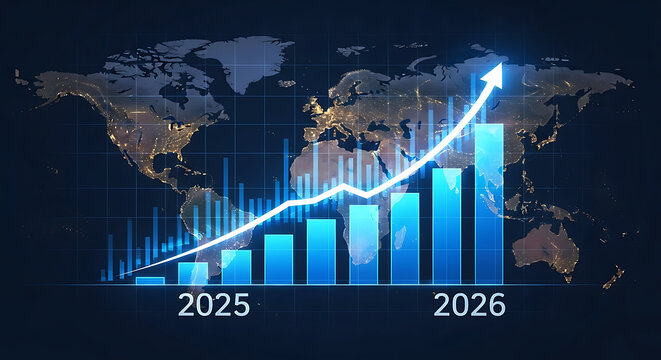
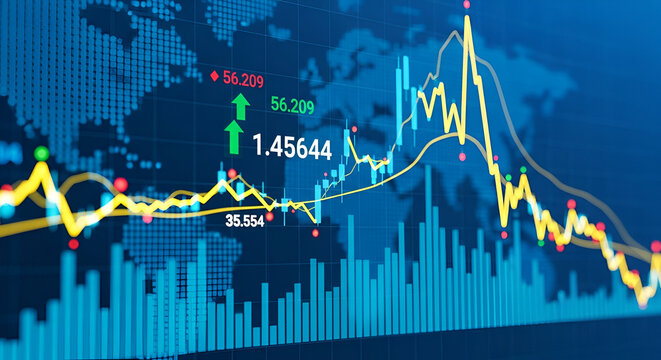
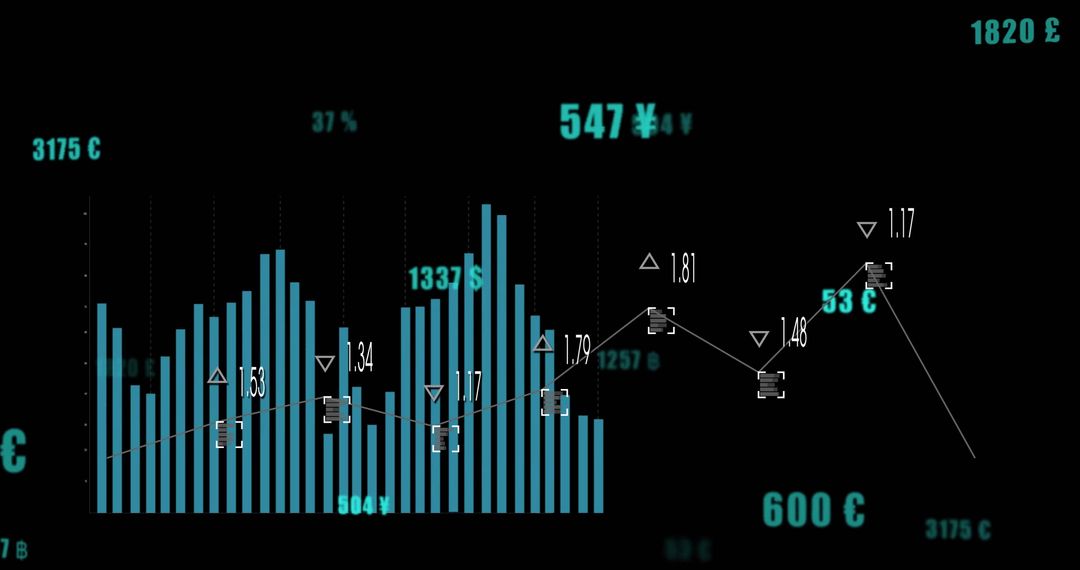
- Global Financial Data Analysis on digital map backdrop exploring trends and insights
Global Financial Data Analysis on digital map backdrop exploring trends and insights Image

Detailed visualization of financial data on digital world map backdrop, ideal for illustrating global business analysis, technological impacts in financial sectors, showing economic trends, and enhancing presentations related to scientific data, financial projections or economic discussions. This is an impactful choice for business, technology, and finance websites or publications that monitor and share analytics data.
Powered by 


0
downloads
downloads
Tags:
More
Credit Photo
If you would like to credit the Photo, here are some ways you can do so
Text Link
photo Link
<span class="text-link">
<span>
<a target="_blank" href=https://pikwizard.com/photo/global-financial-data-analysis-on-digital-map-backdrop-exploring-trends-and-insights/8e950261a956f65ed58f8fe080b98518/>PikWizard</a>
</span>
</span>
<span class="image-link">
<span
style="margin: 0 0 20px 0; display: inline-block; vertical-align: middle; width: 100%;"
>
<a
target="_blank"
href="https://pikwizard.com/photo/global-financial-data-analysis-on-digital-map-backdrop-exploring-trends-and-insights/8e950261a956f65ed58f8fe080b98518/"
style="text-decoration: none; font-size: 10px; margin: 0;"
>
<img src="https://pikwizard.com/pw/medium/8e950261a956f65ed58f8fe080b98518.jpg" style="margin: 0; width: 100%;" alt="" />
<p style="font-size: 12px; margin: 0;">PikWizard</p>
</a>
</span>
</span>
Free (free of charge)
Free for personal and commercial use.
Author: Awesome Content
Similar Free Stock Images

Premium


Premium


Premium


Premium


Premium


Premium


Premium


Premium


Premium


Premium


Premium


Premium


Premium


Premium


Premium


Premium


Premium


Premium


Premium


Premium


Premium


Premium


Premium


Premium