- Home >
- Stock Photos >
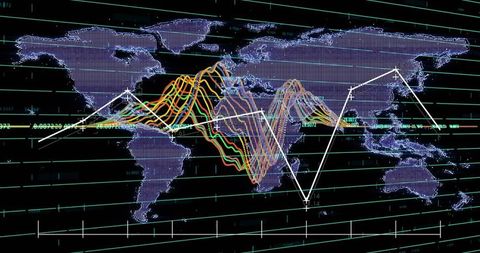
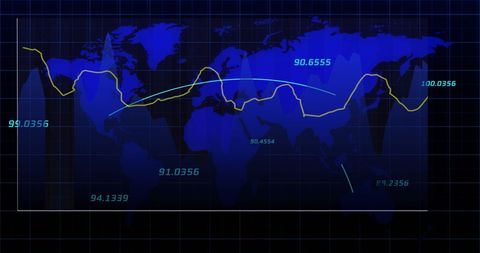
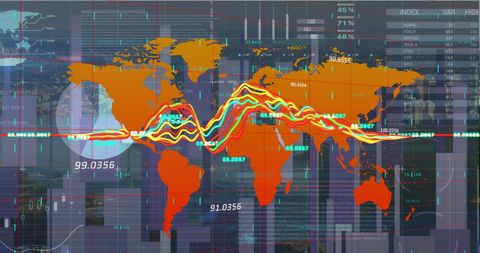
- Global Financial Data Analysis over World Map with Graphs
Global Financial Data Analysis over World Map with Graphs Image

Intricate screen displaying financial data with dynamic graphs overlaying a world map indicates global business and financial markets analysis. Suitable for illustrating concepts in finance, data analysis, or digital connectivity, ideal for presentations, business reports, economics content, or technology brochures.

downloads
Tags:
More
Credit Photo
If you would like to credit the Photo, here are some ways you can do so
Text Link
photo Link
<span class="text-link">
<span>
<a target="_blank" href=https://pikwizard.com/photo/global-financial-data-analysis-over-world-map-with-graphs/e034d225e485173388efee944ad22ab2/>PikWizard</a>
</span>
</span>
<span class="image-link">
<span
style="margin: 0 0 20px 0; display: inline-block; vertical-align: middle; width: 100%;"
>
<a
target="_blank"
href="https://pikwizard.com/photo/global-financial-data-analysis-over-world-map-with-graphs/e034d225e485173388efee944ad22ab2/"
style="text-decoration: none; font-size: 10px; margin: 0;"
>
<img src="https://pikwizard.com/pw/medium/e034d225e485173388efee944ad22ab2.jpg" style="margin: 0; width: 100%;" alt="" />
<p style="font-size: 12px; margin: 0;">PikWizard</p>
</a>
</span>
</span>
Free (free of charge)
Free for personal and commercial use.
Author: Creative Art