- Home >
- Stock Photos >
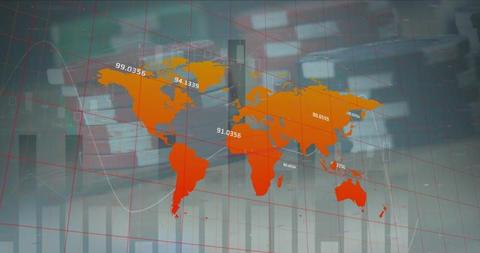
- Global Financial Data Analysis with Declining Trends
Global Financial Data Analysis with Declining Trends Image

Illustrates global business analytics with financial data projected on world map. Features red arrows signaling decline in markets, suitable for use in economic analysis reports, financial forecasts, or business presentations discussing market trends and global economy impacts.

downloads
Tags:
More
Credit Photo
If you would like to credit the Photo, here are some ways you can do so
Text Link
photo Link
<span class="text-link">
<span>
<a target="_blank" href=https://pikwizard.com/photo/global-financial-data-analysis-with-declining-trends/e1b8d54182a2301307ea287e337526d4/>PikWizard</a>
</span>
</span>
<span class="image-link">
<span
style="margin: 0 0 20px 0; display: inline-block; vertical-align: middle; width: 100%;"
>
<a
target="_blank"
href="https://pikwizard.com/photo/global-financial-data-analysis-with-declining-trends/e1b8d54182a2301307ea287e337526d4/"
style="text-decoration: none; font-size: 10px; margin: 0;"
>
<img src="https://pikwizard.com/pw/medium/e1b8d54182a2301307ea287e337526d4.jpg" style="margin: 0; width: 100%;" alt="" />
<p style="font-size: 12px; margin: 0;">PikWizard</p>
</a>
</span>
</span>
Free (free of charge)
Free for personal and commercial use.
Author: People Creations