- Home >
- Stock Photos >
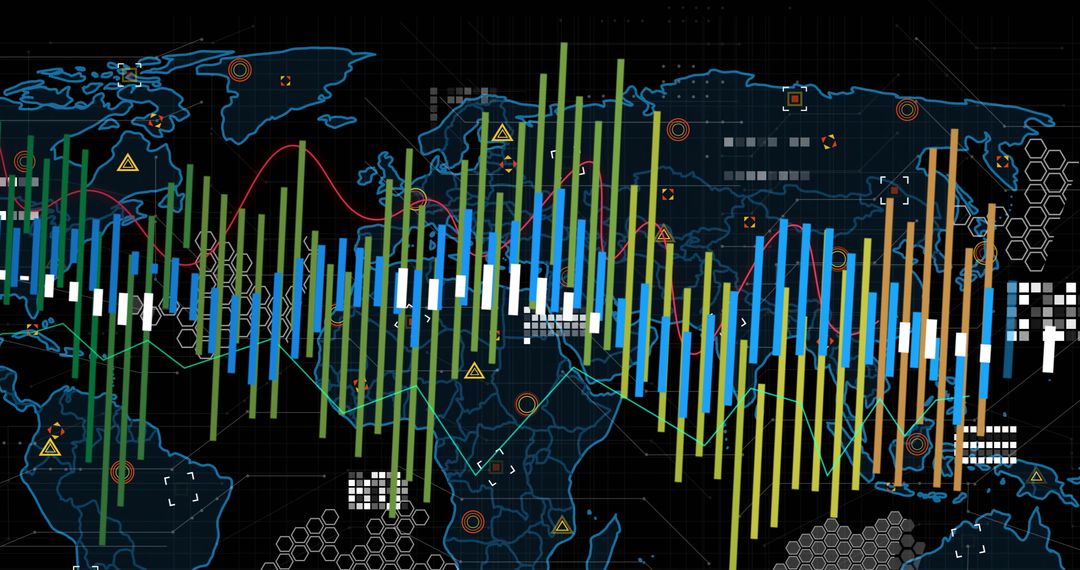
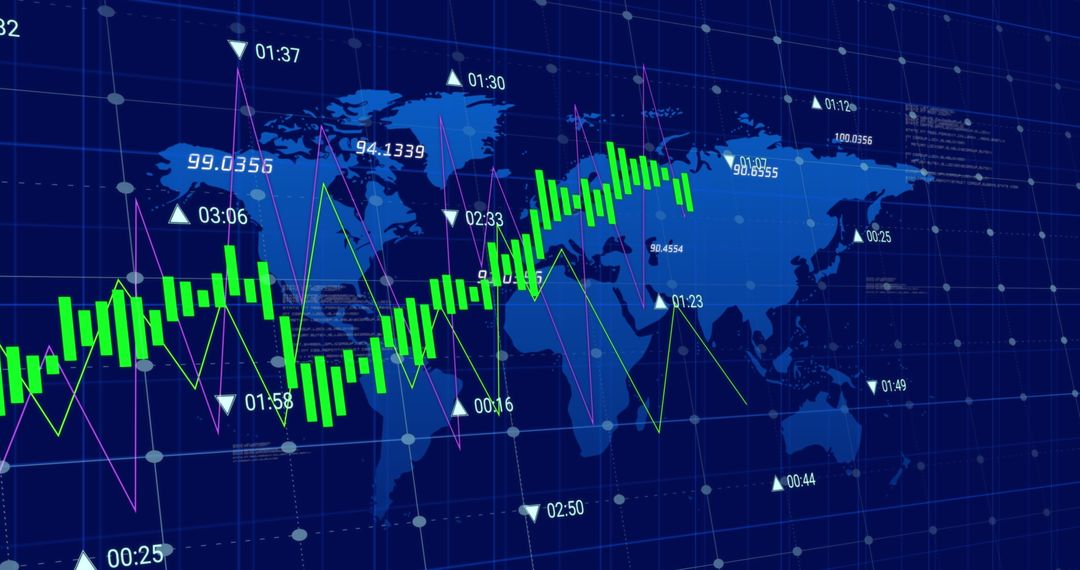
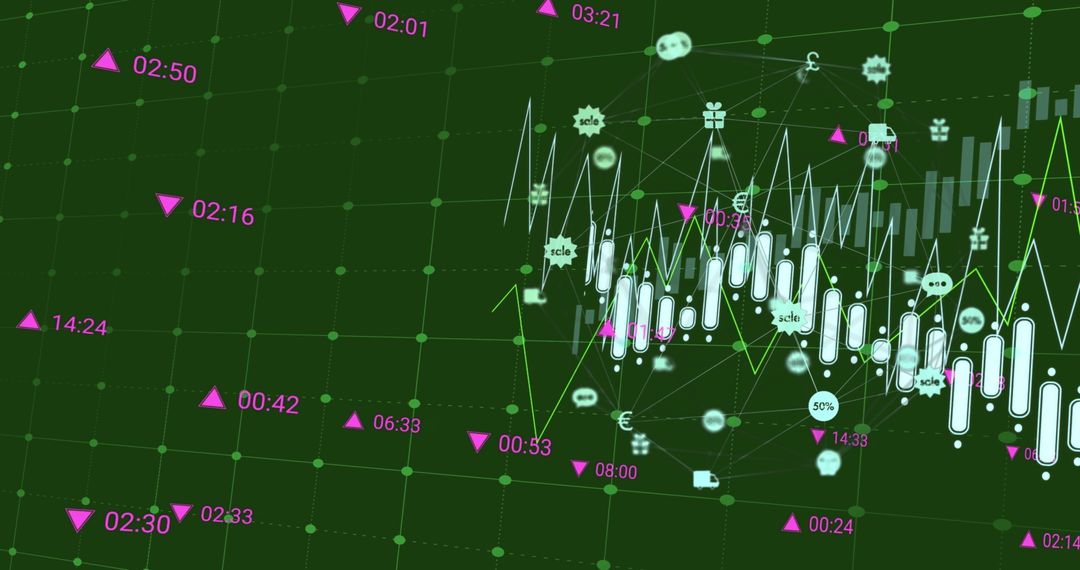
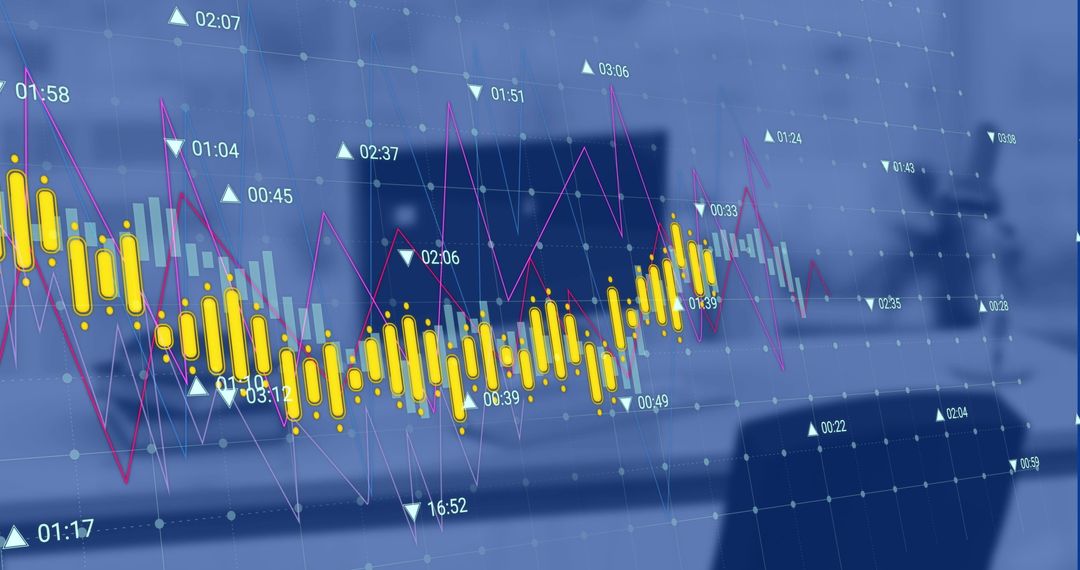
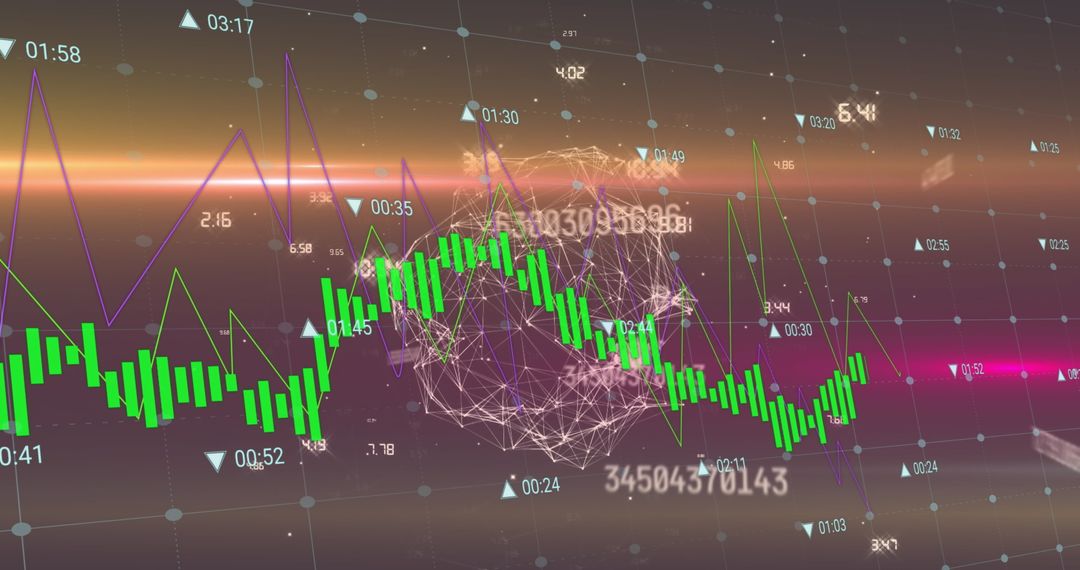
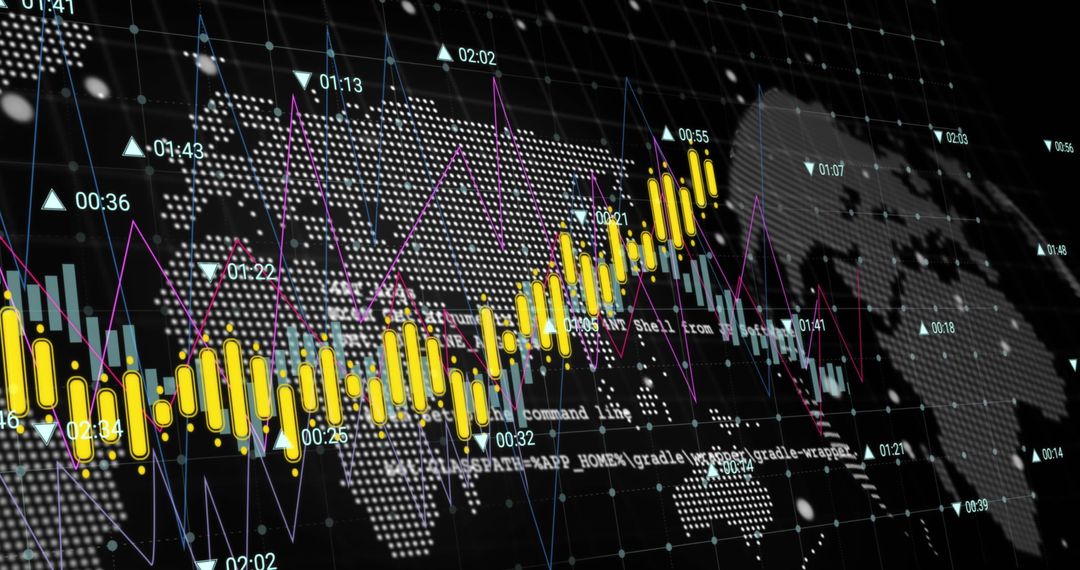
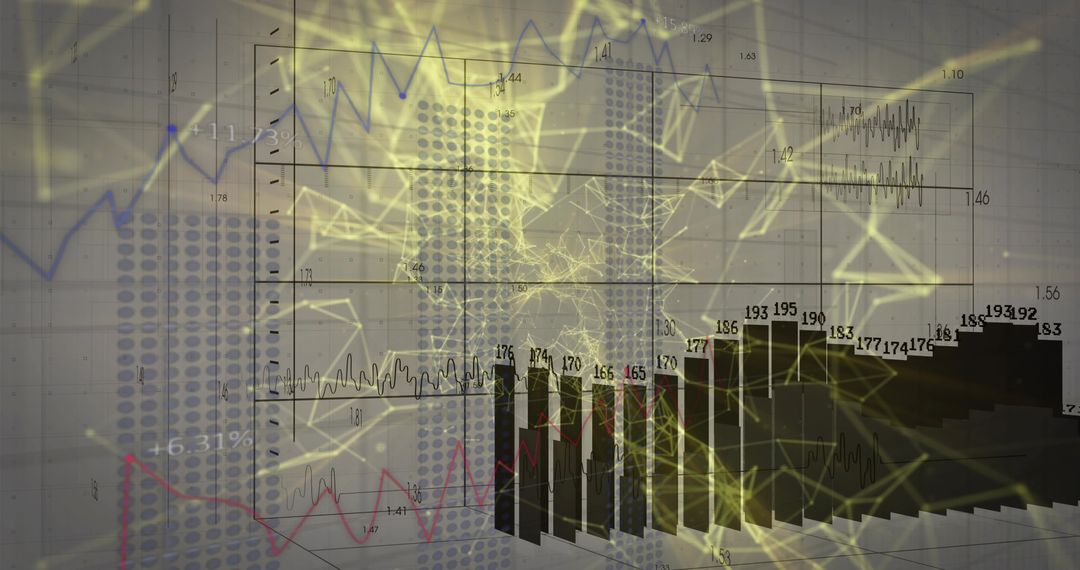
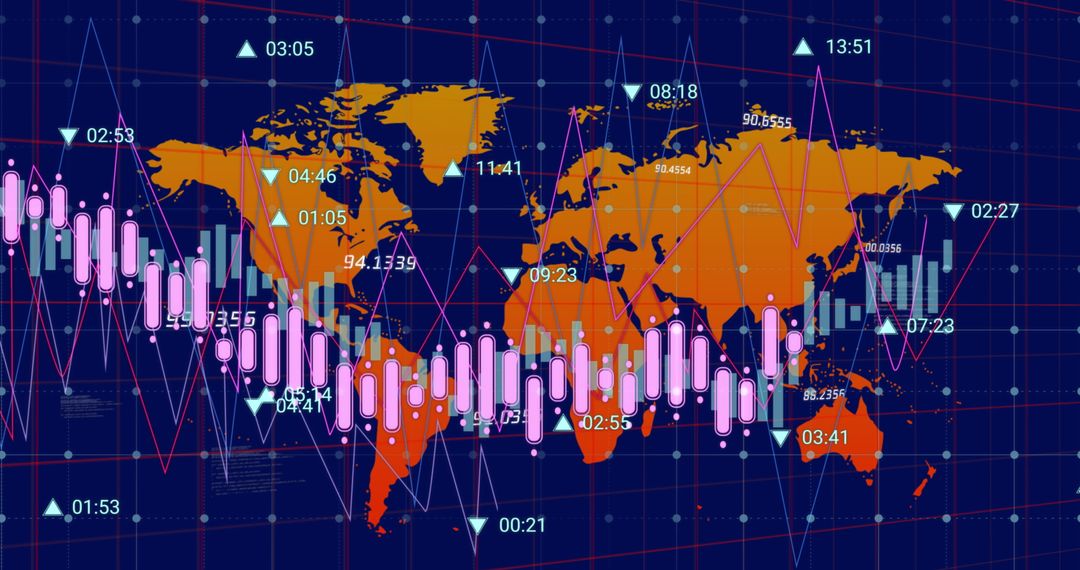
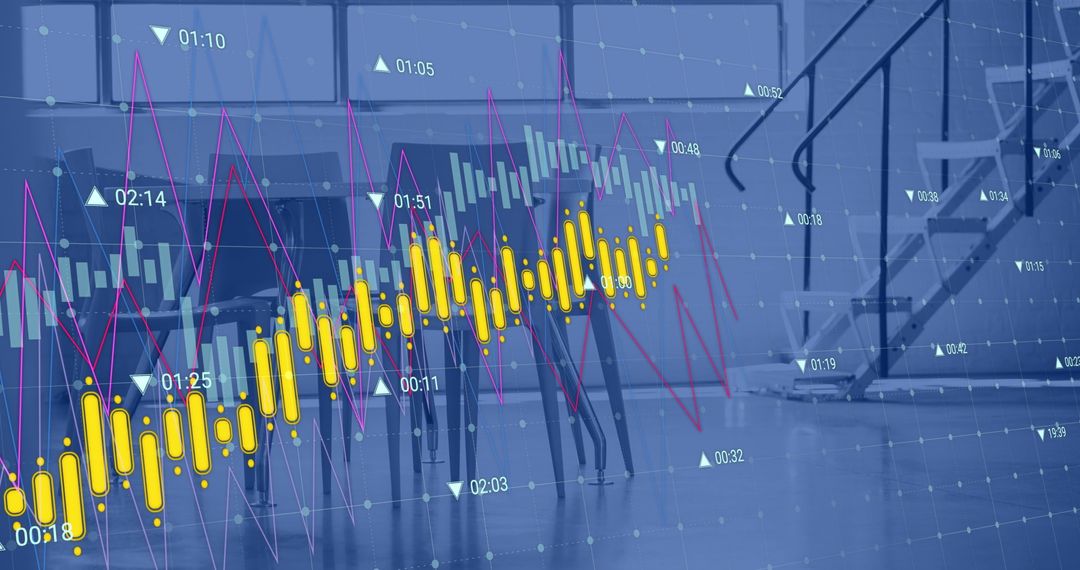
- Global Financial Data Analysis with Digital Graphs
Global Financial Data Analysis with Digital Graphs Image

Digital graphs overlay vivid representations of financial data climbing and diving across global markets, as interpreted on a dynamic world map, encapsulating dynamic financial landscapes and market trends. Ideal for illustrating themes related to global economy, financial markets analysis, data-driven decision making, and technologies in financial sectors for promotional materials, articles, and financial reports.
Powered by 


2
downloads
downloads
Tags:
More
Credit Photo
If you would like to credit the Photo, here are some ways you can do so
Text Link
photo Link
<span class="text-link">
<span>
<a target="_blank" href=https://pikwizard.com/photo/global-financial-data-analysis-with-digital-graphs/004a53268b7c0afd535782bd89139074/>PikWizard</a>
</span>
</span>
<span class="image-link">
<span
style="margin: 0 0 20px 0; display: inline-block; vertical-align: middle; width: 100%;"
>
<a
target="_blank"
href="https://pikwizard.com/photo/global-financial-data-analysis-with-digital-graphs/004a53268b7c0afd535782bd89139074/"
style="text-decoration: none; font-size: 10px; margin: 0;"
>
<img src="https://pikwizard.com/pw/medium/004a53268b7c0afd535782bd89139074.jpg" style="margin: 0; width: 100%;" alt="" />
<p style="font-size: 12px; margin: 0;">PikWizard</p>
</a>
</span>
</span>
Free (free of charge)
Free for personal and commercial use.
Author: Authentic Images
Similar Free Stock Images

Premium


Premium


Premium


Premium


Premium


Premium


Premium


Premium


Premium


Premium


Premium


Premium


Premium


Premium


Premium


Premium


Premium


Premium


Premium


Premium


Premium


Premium


Premium


Premium