- Home >
- Stock Photos >
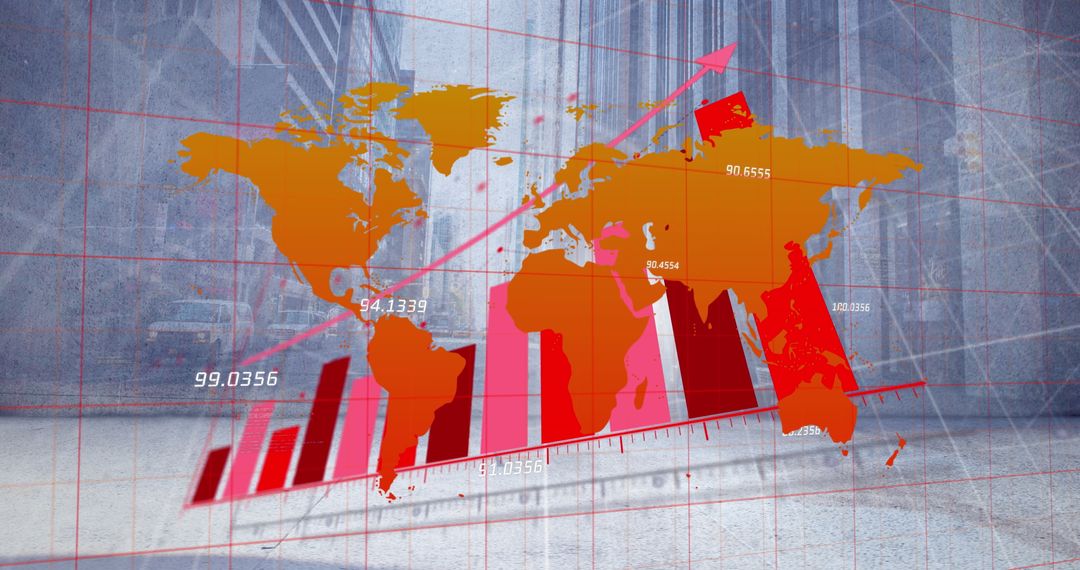
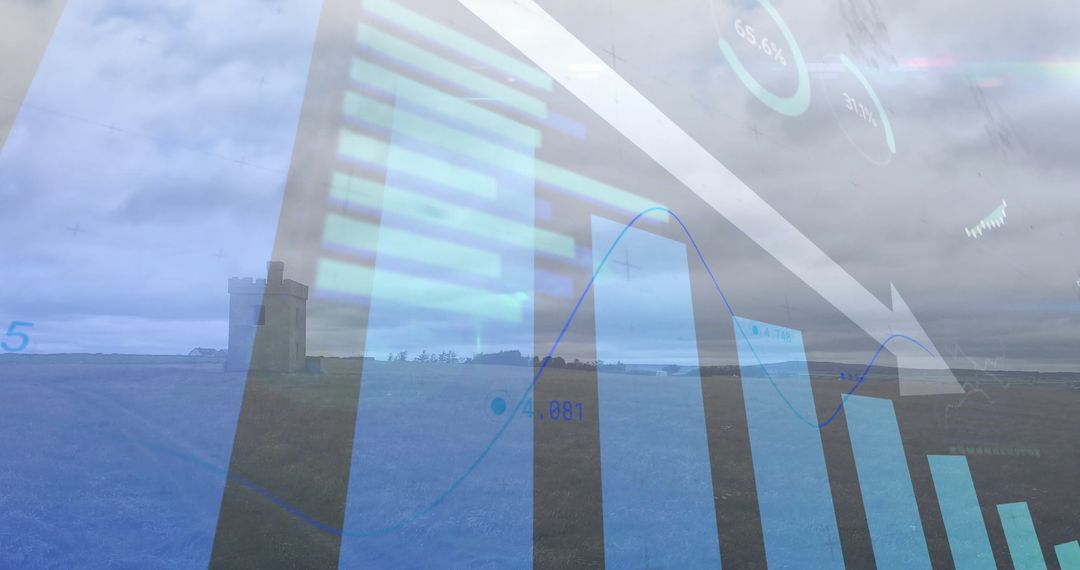
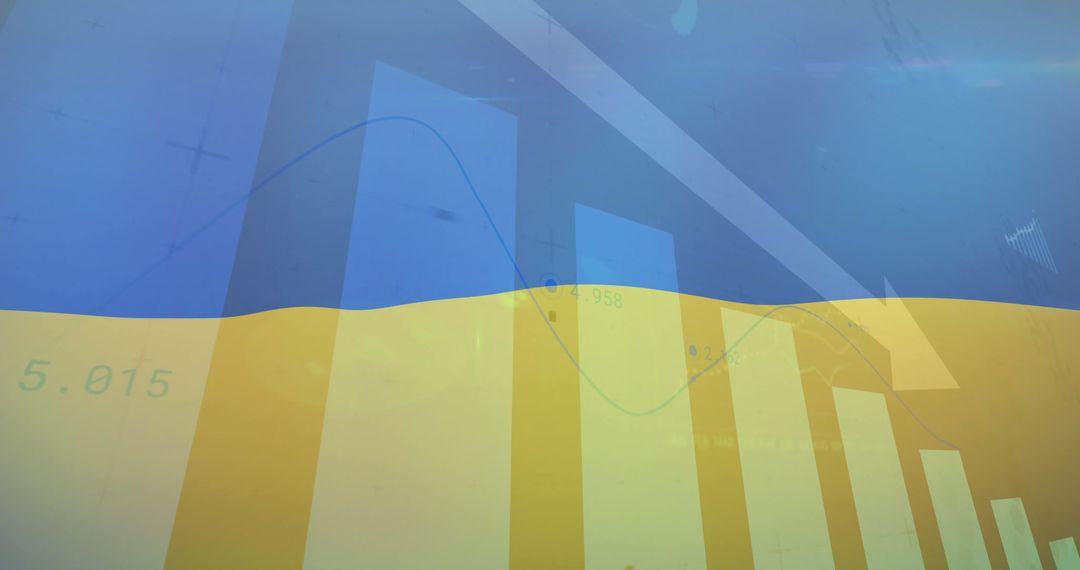
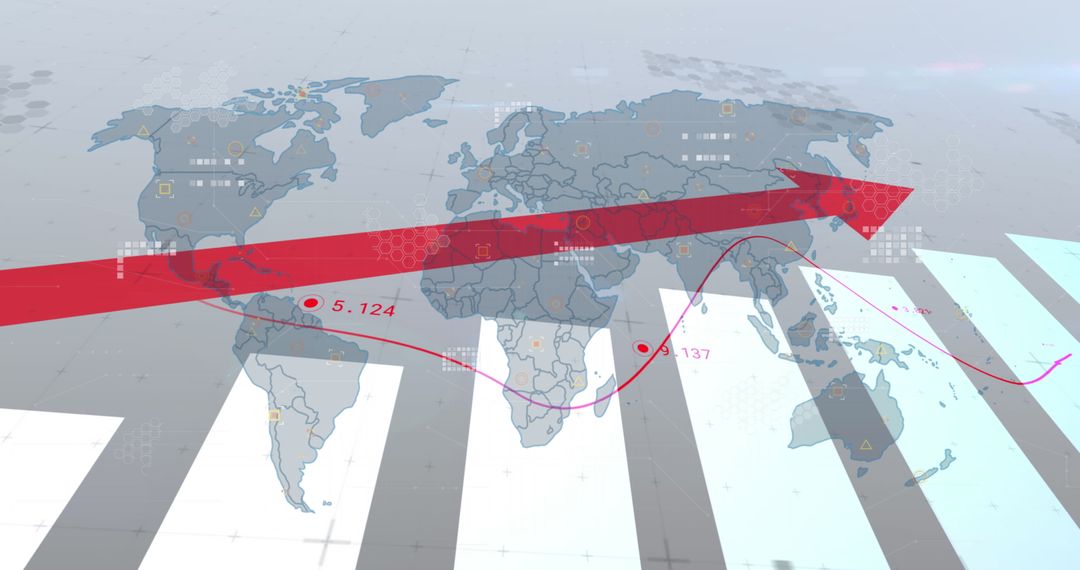
- Global Financial Data Analysis with Downward Trend Arrows
Global Financial Data Analysis with Downward Trend Arrows Image

Detailed depiction of economic downturn highlighted with downward arrows and bar graphs overlaying a world map. Useful for illustrating global economic reports, financial analysis presentations, market forecasts, or articles discussing international business trends. Suitable template for integrating specific company data or contextual market information.
Powered by 


2
downloads
downloads
Tags:
More
Credit Photo
If you would like to credit the Photo, here are some ways you can do so
Text Link
photo Link
<span class="text-link">
<span>
<a target="_blank" href=https://pikwizard.com/photo/global-financial-data-analysis-with-downward-trend-arrows/8d30b34cb37a84d81579a0db01803e92/>PikWizard</a>
</span>
</span>
<span class="image-link">
<span
style="margin: 0 0 20px 0; display: inline-block; vertical-align: middle; width: 100%;"
>
<a
target="_blank"
href="https://pikwizard.com/photo/global-financial-data-analysis-with-downward-trend-arrows/8d30b34cb37a84d81579a0db01803e92/"
style="text-decoration: none; font-size: 10px; margin: 0;"
>
<img src="https://pikwizard.com/pw/medium/8d30b34cb37a84d81579a0db01803e92.jpg" style="margin: 0; width: 100%;" alt="" />
<p style="font-size: 12px; margin: 0;">PikWizard</p>
</a>
</span>
</span>
Free (free of charge)
Free for personal and commercial use.
Author: People Creations
Similar Free Stock Images

Premium


Premium


Premium


Premium


Premium


Premium


Premium


Premium


Premium


Premium


Premium


Premium


Premium


Premium


Premium


Premium


Premium


Premium


Premium


Premium


Premium


Premium


Premium


Premium