- Home >
- Stock Photos >
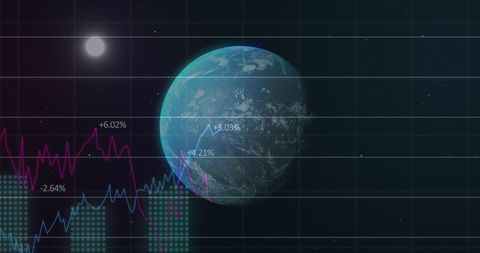
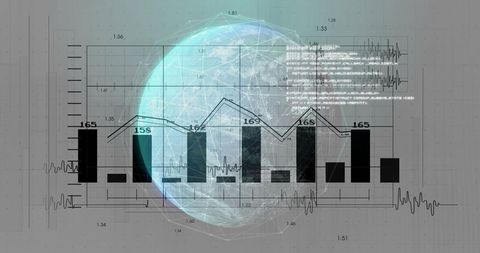
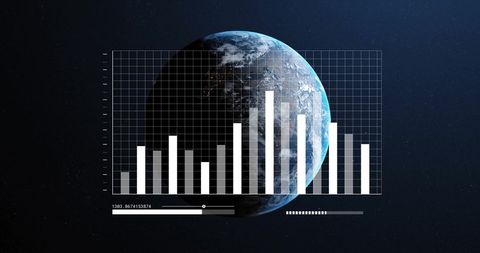
- Global Financial Data Analysis with Earth Image Overlay
Global Financial Data Analysis with Earth Image Overlay Image
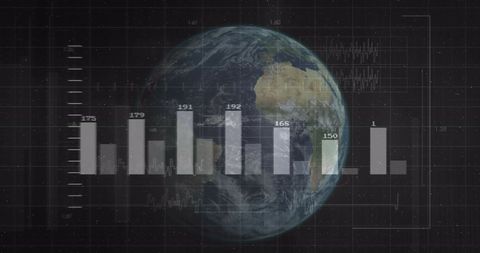
Financial data and graphs overlay a view of Earth, symbolizing global market analysis. Clear representation of numerics suggests financial progress or forecasting. Suitable for illustrating global business themes, financial reports, or economic studies presentations.
Powered by 


2
downloads
downloads
Tags:
More
Credit Photo
If you would like to credit the Photo, here are some ways you can do so
Text Link
photo Link
<span class="text-link">
<span>
<a target="_blank" href=https://pikwizard.com/photo/global-financial-data-analysis-with-earth-image-overlay/8261261a752335bd892b4267d2faefd6/>PikWizard</a>
</span>
</span>
<span class="image-link">
<span
style="margin: 0 0 20px 0; display: inline-block; vertical-align: middle; width: 100%;"
>
<a
target="_blank"
href="https://pikwizard.com/photo/global-financial-data-analysis-with-earth-image-overlay/8261261a752335bd892b4267d2faefd6/"
style="text-decoration: none; font-size: 10px; margin: 0;"
>
<img src="https://pikwizard.com/pw/medium/8261261a752335bd892b4267d2faefd6.jpg" style="margin: 0; width: 100%;" alt="" />
<p style="font-size: 12px; margin: 0;">PikWizard</p>
</a>
</span>
</span>
Free (free of charge)
Free for personal and commercial use.
Author: Creative Art
Similar Free Stock Images
Loading...

Premium


Premium


Premium


Premium


Premium


Premium


Premium

Premium

Premium


Premium


Premium


Premium


Premium


Premium

Premium

Premium


Premium


Premium


Premium


Premium


Premium


Premium


Premium


Premium


Premium