- Home >
- Stock Photos >
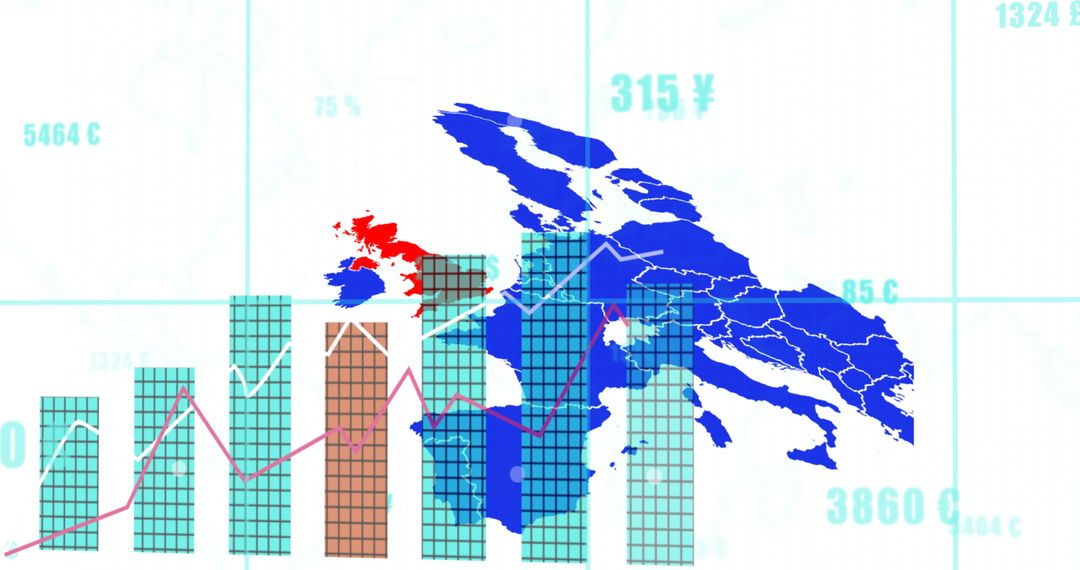
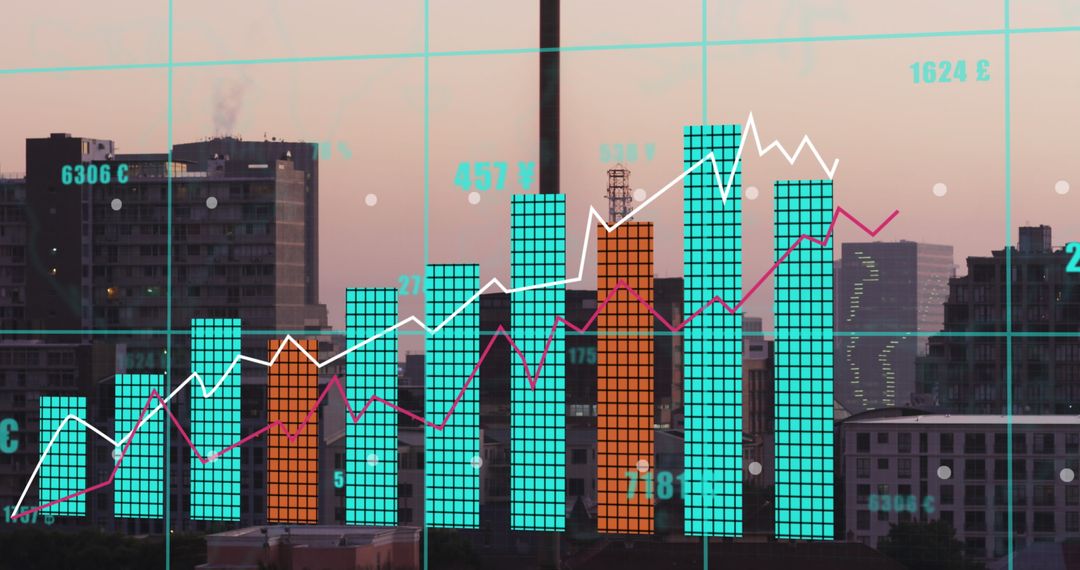
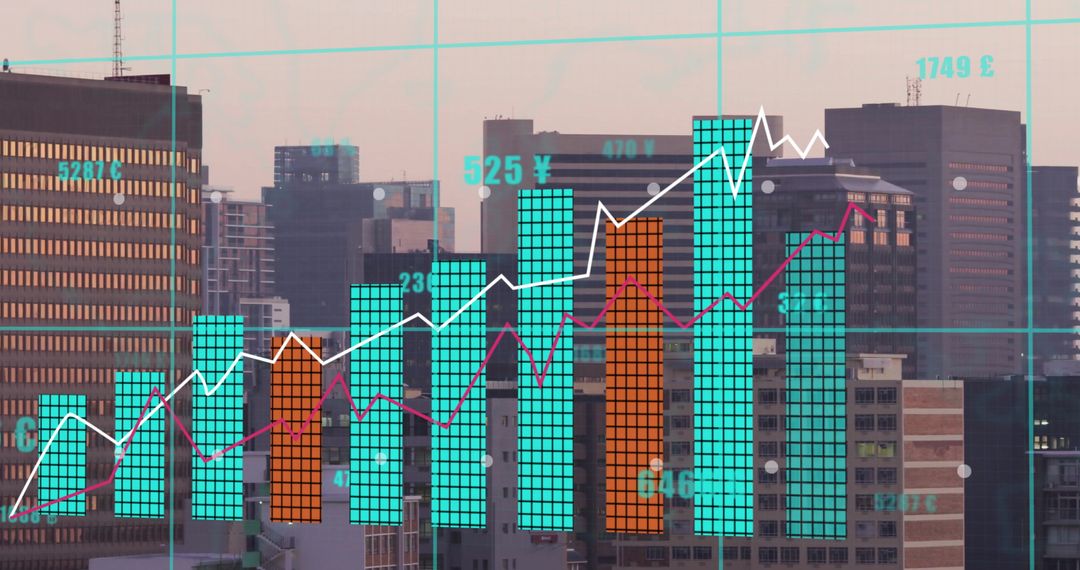
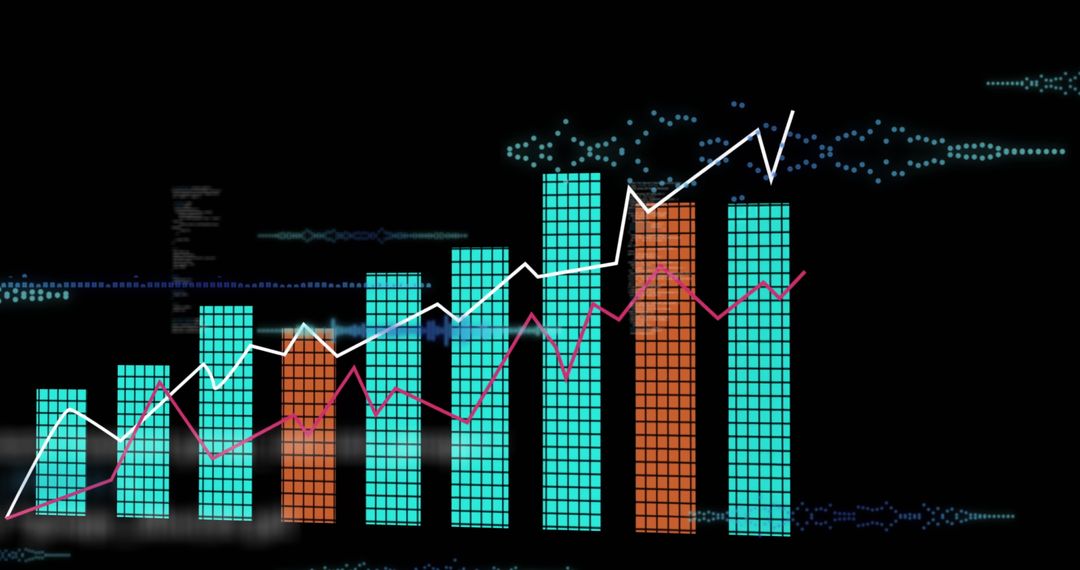
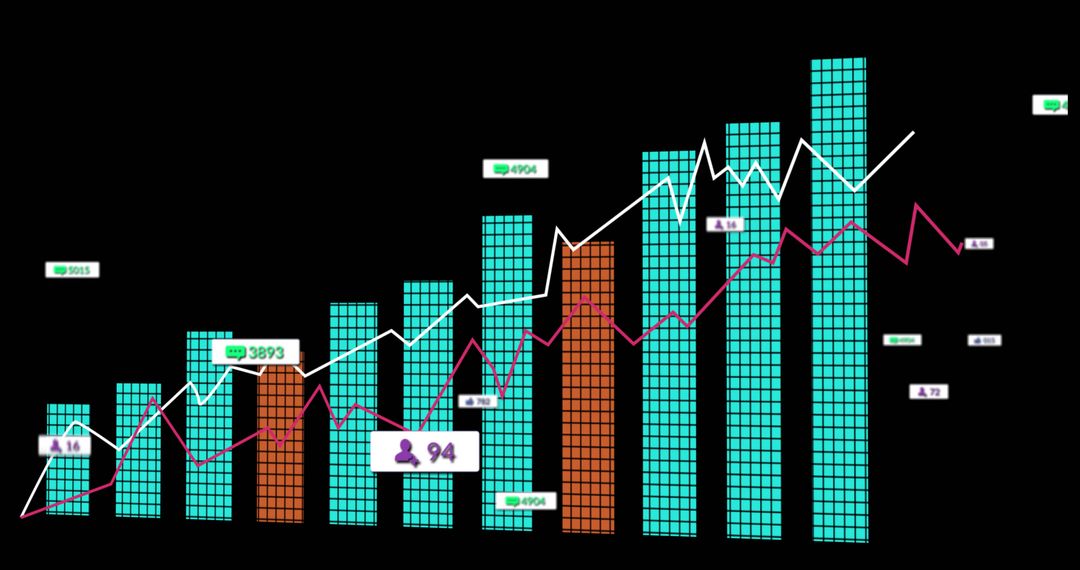
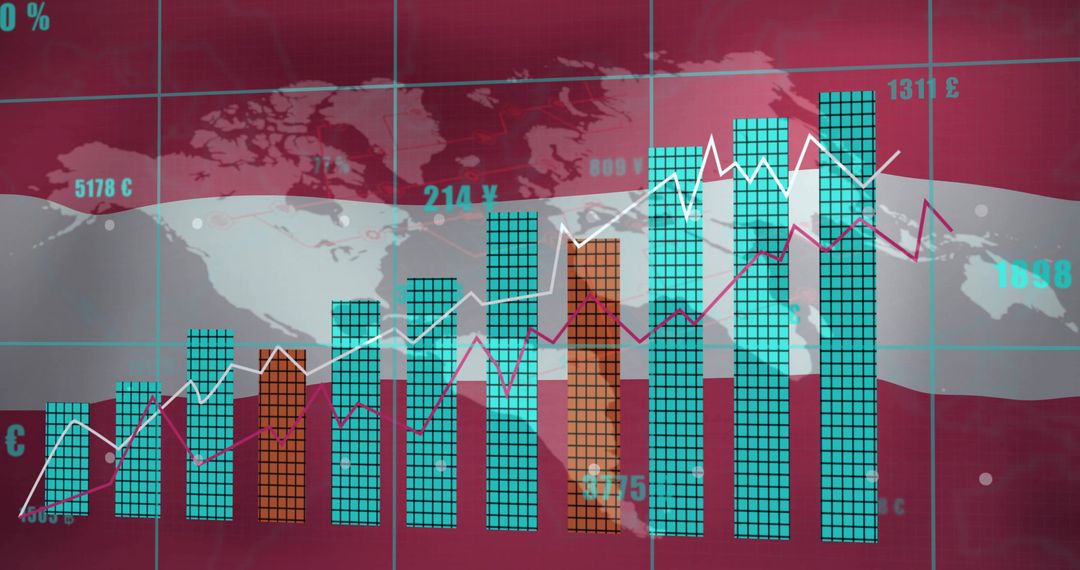
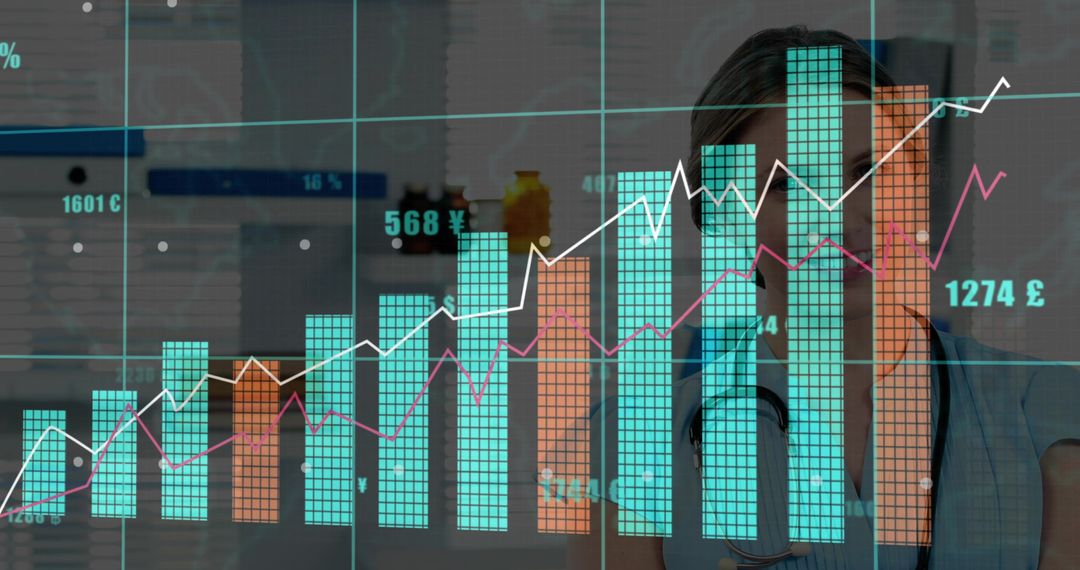
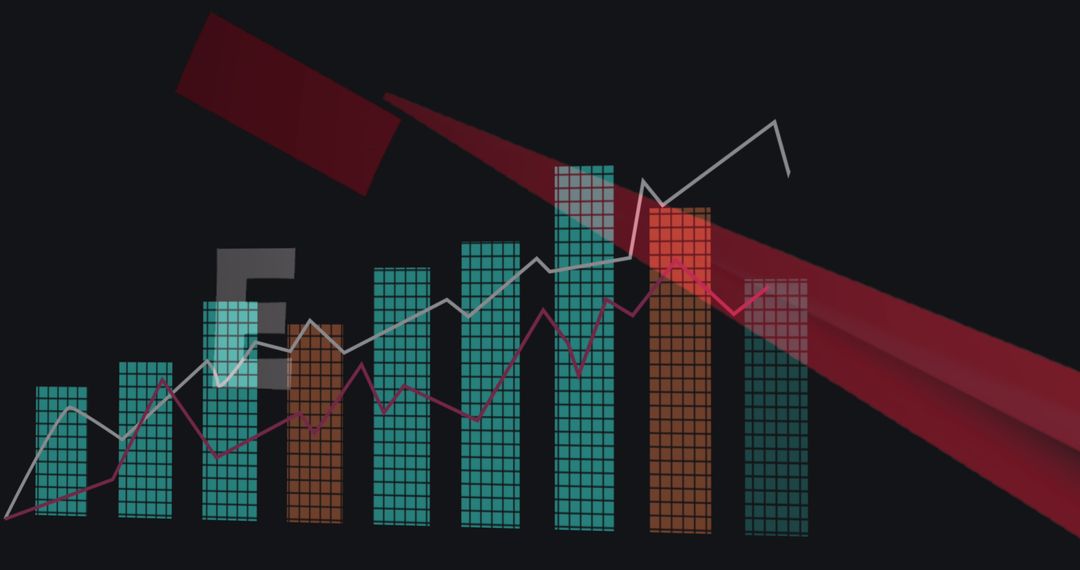
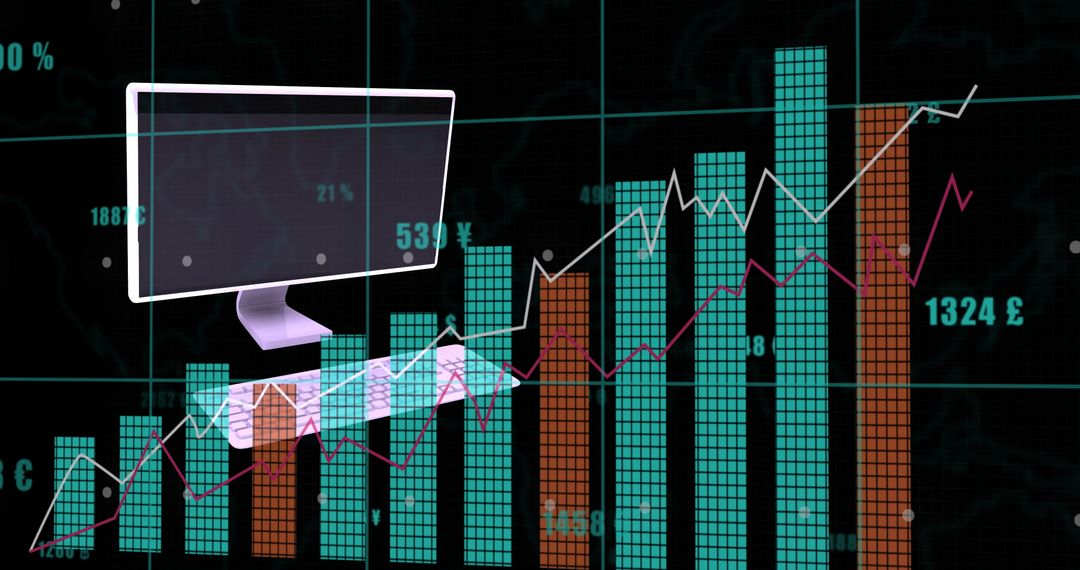
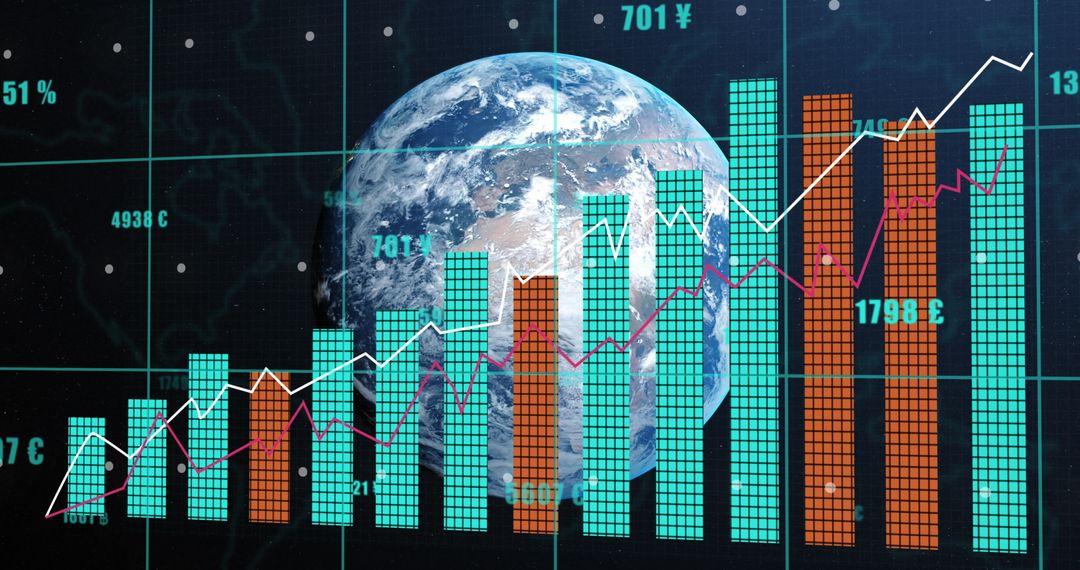
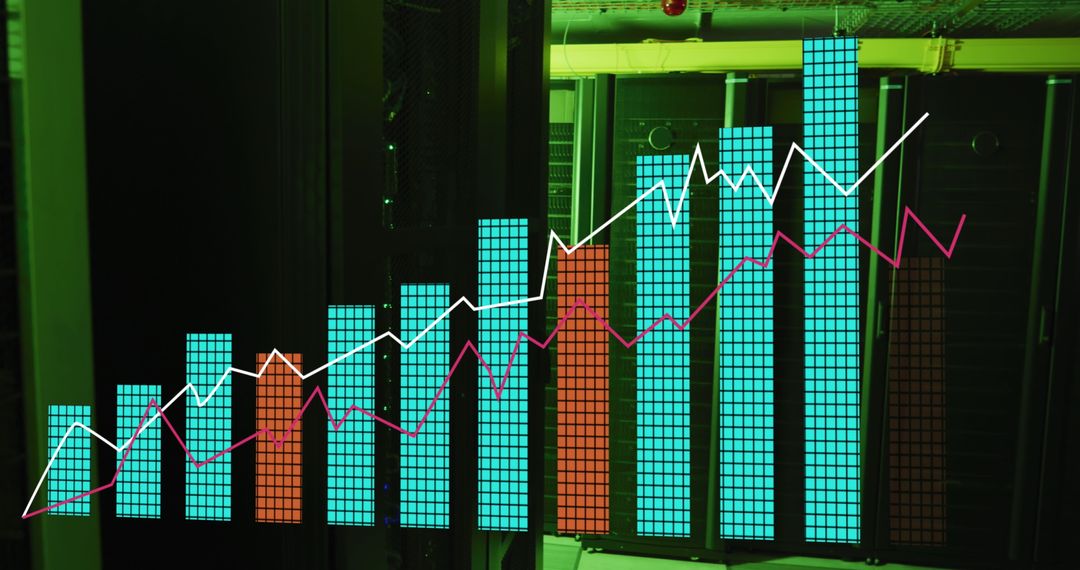
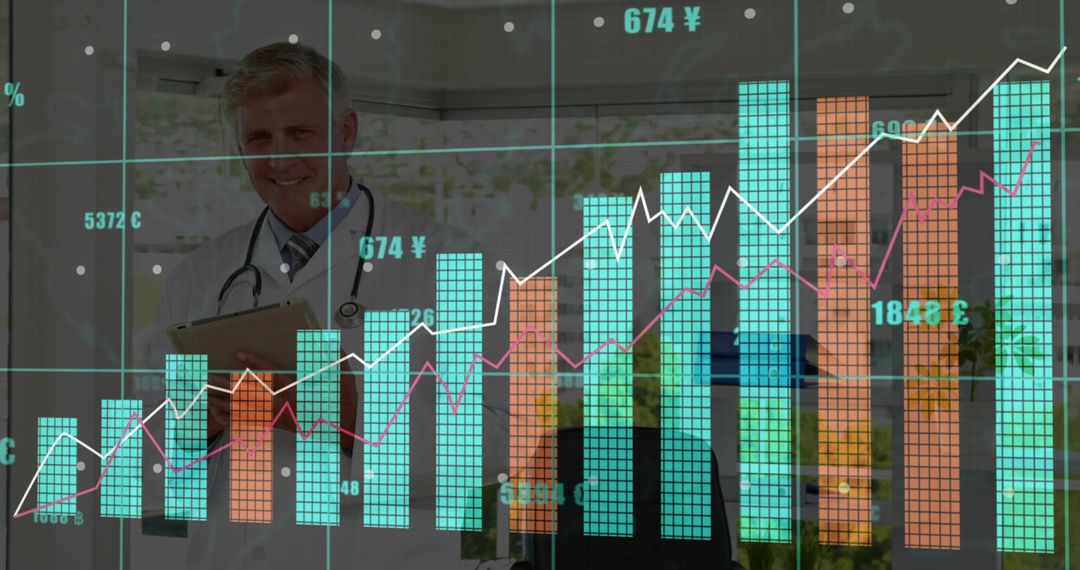
- Global Financial Data Analysis with Graphs and Currency Chart
Global Financial Data Analysis with Graphs and Currency Chart Image

Digital rendering shows integration of financial data and analysis tools in an office environment. Curved, colorful bar graphs and currency symbols underscore focus on international markets. Ideal for illustrating global business intelligence, data-driven financial strategies, and economic reports. Utilizable in financial reports, presentations, and economic analyses.
Powered by  - Get 15% off with code: PIKWIZARD15


0
downloads
downloads
Tags:
More
Credit Photo
If you would like to credit the Photo, here are some ways you can do so
Text Link
photo Link
<span class="text-link">
<span>
<a target="_blank" href=https://pikwizard.com/photo/global-financial-data-analysis-with-graphs-and-currency-chart/0d6f440db2d568646c32f2d051769627/>PikWizard</a>
</span>
</span>
<span class="image-link">
<span
style="margin: 0 0 20px 0; display: inline-block; vertical-align: middle; width: 100%;"
>
<a
target="_blank"
href="https://pikwizard.com/photo/global-financial-data-analysis-with-graphs-and-currency-chart/0d6f440db2d568646c32f2d051769627/"
style="text-decoration: none; font-size: 10px; margin: 0;"
>
<img src="https://pikwizard.com/pw/medium/0d6f440db2d568646c32f2d051769627.jpg" style="margin: 0; width: 100%;" alt="" />
<p style="font-size: 12px; margin: 0;">PikWizard</p>
</a>
</span>
</span>
Free (free of charge)
Free for personal and commercial use.
Author: Awesome Content
Similar Free Stock Images
Premium


Premium


Premium


Premium


Premium


Premium


Premium


Premium


Premium


Premium


Premium


Premium


Premium


Premium


Premium


Premium


Premium


Premium


Premium


Premium


Premium


Premium


Premium


Premium