- Home >
- Stock Photos >
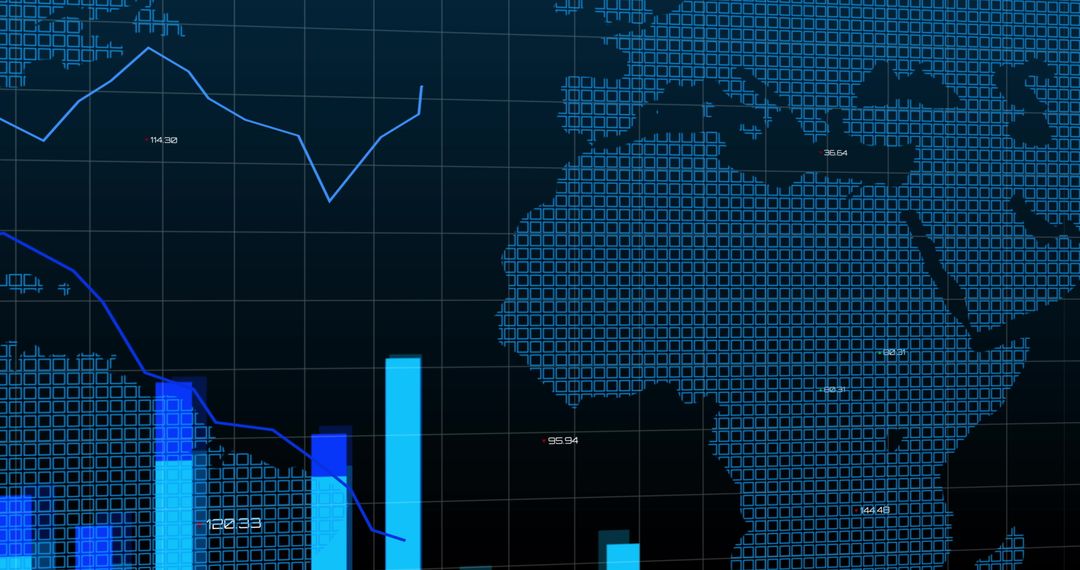
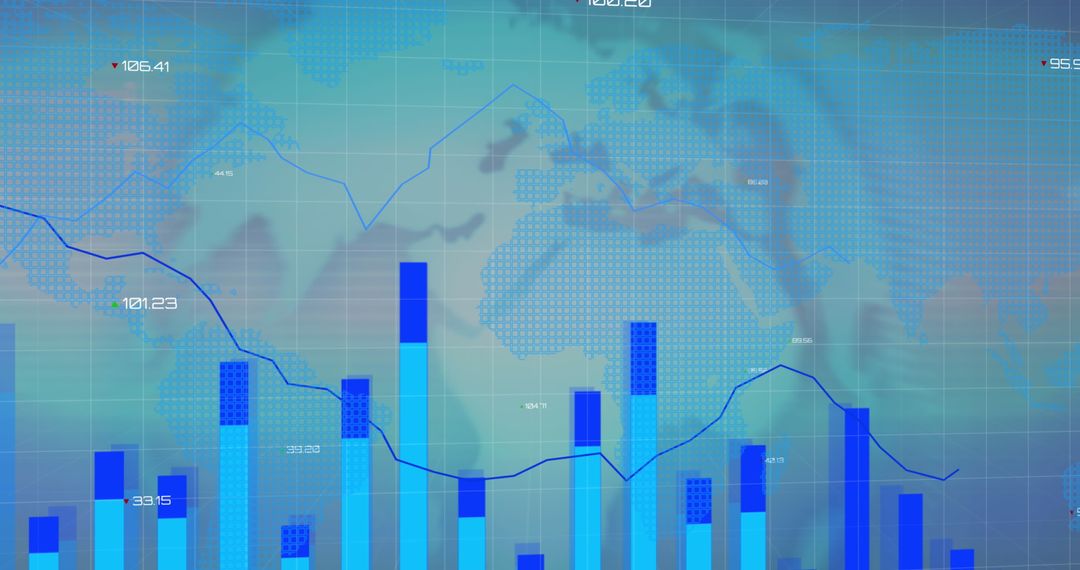
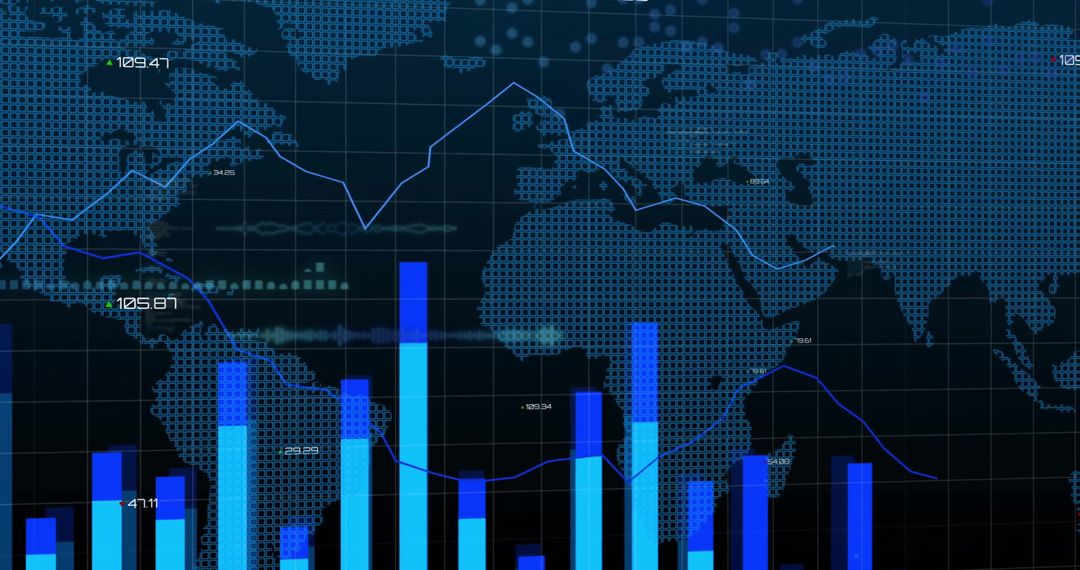
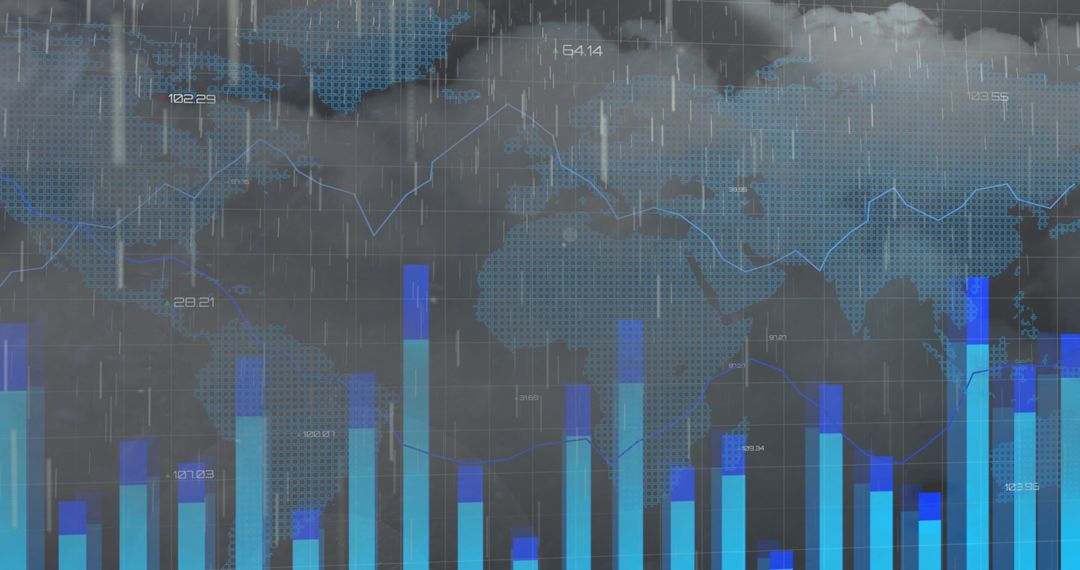
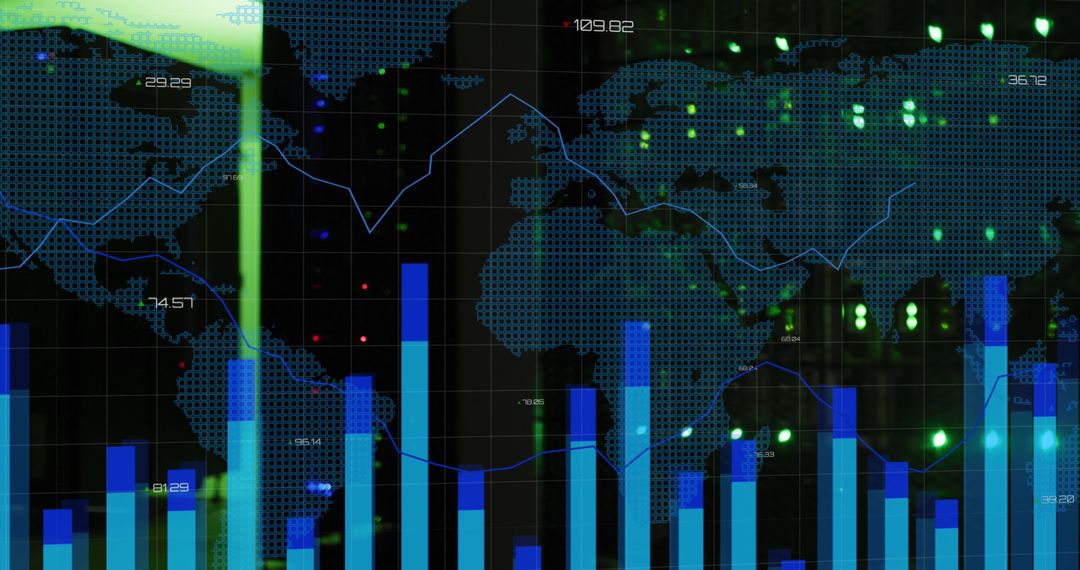
- Global Financial Data Analysis with Graphs and World Map Overlay
Global Financial Data Analysis with Graphs and World Map Overlay Image

Blue-toned visualization combining global maps with statistical bar graphs, highlighting worldwide economic trends. Hourly data representation throughout regions showcases trends and market changes. Perfect for presentations, reports on global financial markets, investments insights, and business strategy analytics.
Powered by 


2
downloads
downloads
Tags:
More
Credit Photo
If you would like to credit the Photo, here are some ways you can do so
Text Link
photo Link
<span class="text-link">
<span>
<a target="_blank" href=https://pikwizard.com/photo/global-financial-data-analysis-with-graphs-and-world-map-overlay/b4a97c4709c9ea5013f962c6cb73b247/>PikWizard</a>
</span>
</span>
<span class="image-link">
<span
style="margin: 0 0 20px 0; display: inline-block; vertical-align: middle; width: 100%;"
>
<a
target="_blank"
href="https://pikwizard.com/photo/global-financial-data-analysis-with-graphs-and-world-map-overlay/b4a97c4709c9ea5013f962c6cb73b247/"
style="text-decoration: none; font-size: 10px; margin: 0;"
>
<img src="https://pikwizard.com/pw/medium/b4a97c4709c9ea5013f962c6cb73b247.jpg" style="margin: 0; width: 100%;" alt="" />
<p style="font-size: 12px; margin: 0;">PikWizard</p>
</a>
</span>
</span>
Free (free of charge)
Free for personal and commercial use.
Author: Creative Art
Similar Free Stock Images
Premium


Premium


Premium


Premium


Premium


Premium


Premium


Premium


Premium


Premium


Premium


Premium


Premium


Premium


Premium


Premium


Premium


Premium


Premium


Premium


Premium


Premium


Premium


Premium