
- Home >
- Stock Photos >
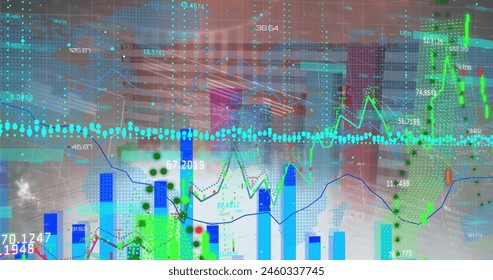
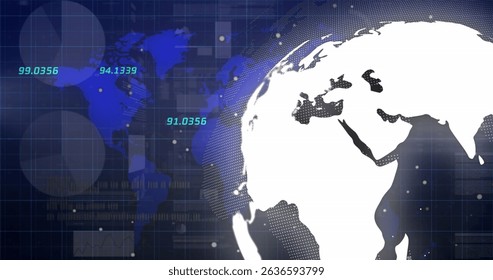
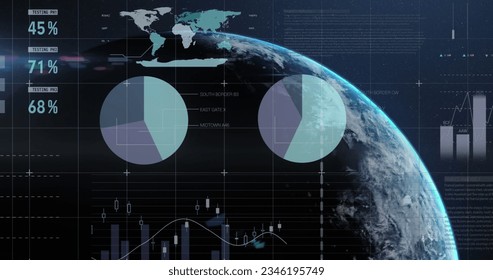
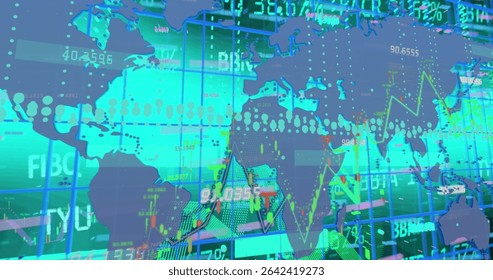
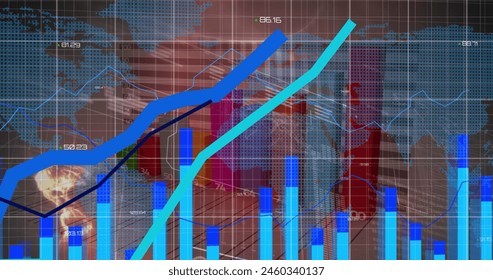
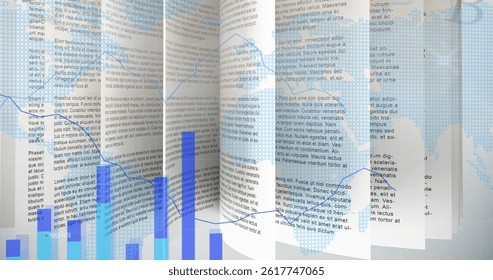
- Global Financial Data Analysis with Graphs and World Map
Global Financial Data Analysis with Graphs and World Map Image
Digital composite of financial graphs and charts layered over an abstract world map, representing global business and economic analysis. Useful for articles and presentations on economic trends, finance sector analytics, and international market strategies. Ideal for illustrating technology-driven data analysis and decision-making processes in global finance.
Powered by  - Get 15% off with code: PIKWIZARD15


downloads
Tags:
More
Credit Photo
If you would like to credit the Photo, here are some ways you can do so
Text Link
photo Link
<span class="text-link">
<span>
<a target="_blank" href=https://pikwizard.com/photo/global-financial-data-analysis-with-graphs-and-world-map/9c0891c0a22b693362a1886bf1aa4c1f/>PikWizard</a>
</span>
</span>
<span class="image-link">
<span
style="margin: 0 0 20px 0; display: inline-block; vertical-align: middle; width: 100%;"
>
<a
target="_blank"
href="https://pikwizard.com/photo/global-financial-data-analysis-with-graphs-and-world-map/9c0891c0a22b693362a1886bf1aa4c1f/"
style="text-decoration: none; font-size: 10px; margin: 0;"
>
<img src="https://pikwizard.com/pw/medium/9c0891c0a22b693362a1886bf1aa4c1f.jpg" style="margin: 0; width: 100%;" alt="" />
<p style="font-size: 12px; margin: 0;">PikWizard</p>
</a>
</span>
</span>
Free (free of charge)
Free for personal and commercial use.
Author: Creative Art
Similar Free Stock Images

Premium


Premium


Premium


Premium

Premium


Premium


Premium


Premium


Premium


Premium

Premium


Premium


Premium


AI

Premium


Premium


Premium


Premium


Premium


Premium


Premium


Premium


Premium


Premium


Premium


Premium


Explore More Free Stock Images