
- Home >
- Stock Photos >
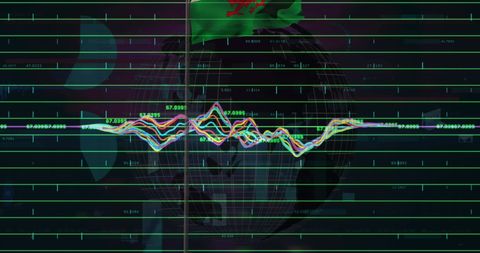
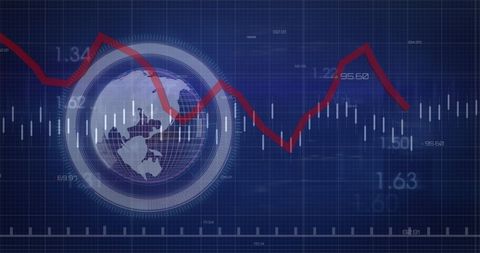
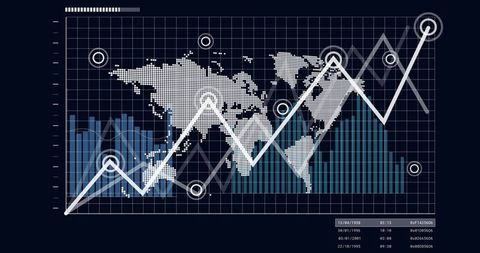
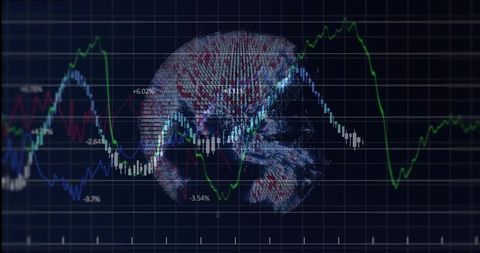
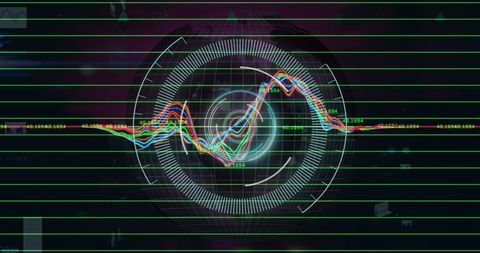
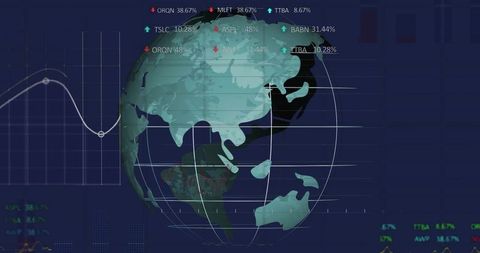
- Global Financial Data Analysis with Graphs on Digital Interface
Global Financial Data Analysis with Graphs on Digital Interface Image

Visual representing intersection of global finance and digital technology, this digital interface showcases innovative financial data and graphs wrapping around a rotating globe. Suitable for illustrating international economic trends, digital finance tools, and global market analysis in publications, presentations, or web content.
Powered by 


downloads
Tags:
More
Credit Photo
If you would like to credit the Photo, here are some ways you can do so
Text Link
photo Link
<span class="text-link">
<span>
<a target="_blank" href=https://pikwizard.com/photo/global-financial-data-analysis-with-graphs-on-digital-interface/3d0e999d95c3c710d85285c5080fc18e/>PikWizard</a>
</span>
</span>
<span class="image-link">
<span
style="margin: 0 0 20px 0; display: inline-block; vertical-align: middle; width: 100%;"
>
<a
target="_blank"
href="https://pikwizard.com/photo/global-financial-data-analysis-with-graphs-on-digital-interface/3d0e999d95c3c710d85285c5080fc18e/"
style="text-decoration: none; font-size: 10px; margin: 0;"
>
<img src="https://pikwizard.com/pw/medium/3d0e999d95c3c710d85285c5080fc18e.jpg" style="margin: 0; width: 100%;" alt="" />
<p style="font-size: 12px; margin: 0;">PikWizard</p>
</a>
</span>
</span>
Free (free of charge)
Free for personal and commercial use.
Author: People Creations
Similar Free Stock Images

Premium


Premium

Premium


Premium


Premium


Premium

Premium


Premium


Premium


Premium

Premium


Premium


Premium


Premium


Premium


Premium

Premium


Premium


Premium


Premium


Premium


Premium


Premium


Premium


Premium


Explore More Free Stock Images