
- Home >
- Stock Photos >
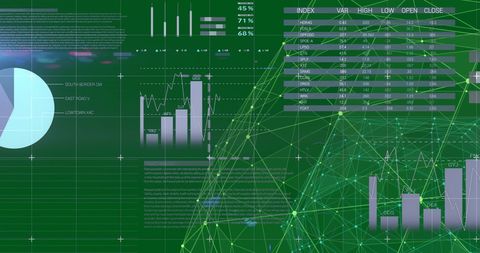
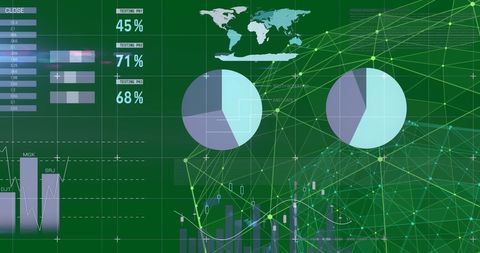
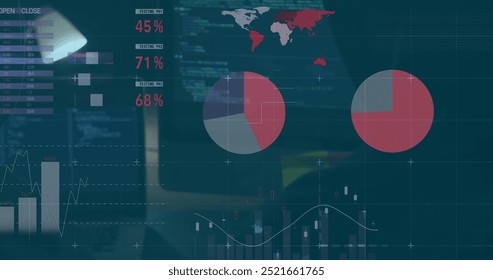
- Global Financial Data Analysis with Interactive Charts
Global Financial Data Analysis with Interactive Charts Image

Complex charts and graphs showcase intricate global financial patterns. Interactive visualizations make it ideal for presentations, reports, or educational materials about finance, computing, or data processing. Useful for illustrating concepts in global economy, market trends, or business strategy.
Powered by  - Get 15% off with code: PIKWIZARD15


downloads
Tags:
More
Credit Photo
If you would like to credit the Photo, here are some ways you can do so
Text Link
photo Link
<span class="text-link">
<span>
<a target="_blank" href=https://pikwizard.com/photo/global-financial-data-analysis-with-interactive-charts/dc30973fa059f267c813e8e7ace9ba29/>PikWizard</a>
</span>
</span>
<span class="image-link">
<span
style="margin: 0 0 20px 0; display: inline-block; vertical-align: middle; width: 100%;"
>
<a
target="_blank"
href="https://pikwizard.com/photo/global-financial-data-analysis-with-interactive-charts/dc30973fa059f267c813e8e7ace9ba29/"
style="text-decoration: none; font-size: 10px; margin: 0;"
>
<img src="https://pikwizard.com/pw/medium/dc30973fa059f267c813e8e7ace9ba29.jpg" style="margin: 0; width: 100%;" alt="" />
<p style="font-size: 12px; margin: 0;">PikWizard</p>
</a>
</span>
</span>
Free (free of charge)
Free for personal and commercial use.
Author: Authentic Images
Similar Free Stock Images

Premium


Premium


Premium

Premium


Premium


Premium


Premium

Premium

Premium


Premium


Premium


Premium


Premium


Premium


Premium


Premium


Premium


Premium


Premium


Premium


Premium


Premium


Premium


Premium


Premium

Explore More Free Stock Images