
- Home >
- Stock Photos >
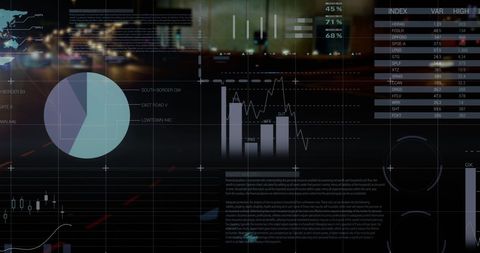
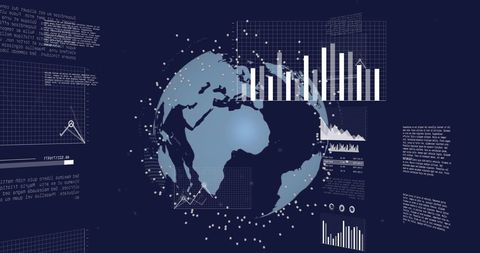
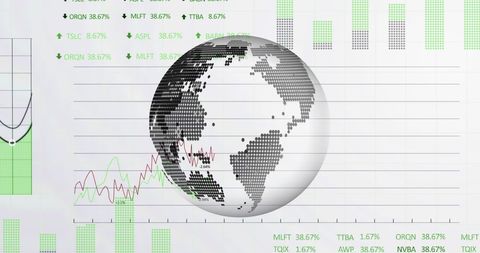
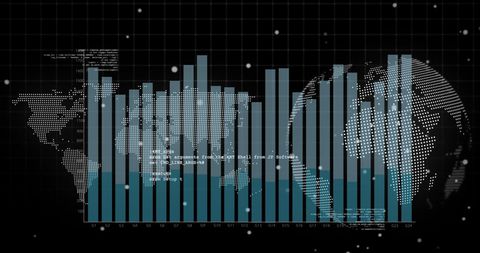
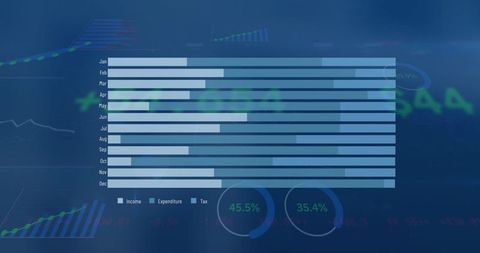
- Global Financial Data Analysis with Interactive Graph
Global Financial Data Analysis with Interactive Graph Image
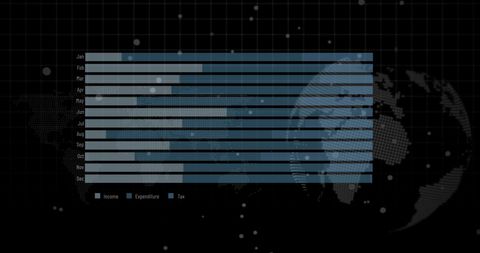
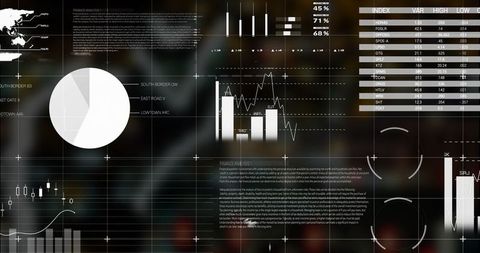
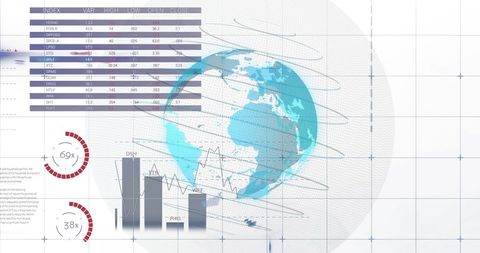
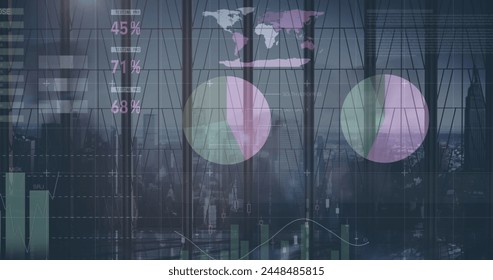
Dynamic representation of global financial data showcasing income, expenditure, and tax across a calendar year. The image features a bar graph overlaying a stylized world map with a digital design ambience, capturing the intersection of finance and technology. Ideal for illustrating financial reports, presentations on global economic analysis, or articles relating to big data trends. The user-friendly graphical layout emphasizes readability and clarity in complex information settings.
Powered by  - Get 15% off with code: PIKWIZARD15


downloads
Tags:
More
Credit Photo
If you would like to credit the Photo, here are some ways you can do so
Text Link
photo Link
<span class="text-link">
<span>
<a target="_blank" href=https://pikwizard.com/photo/global-financial-data-analysis-with-interactive-graph/9184e80b1cc1ee5a5177bbe4cb878f15/>PikWizard</a>
</span>
</span>
<span class="image-link">
<span
style="margin: 0 0 20px 0; display: inline-block; vertical-align: middle; width: 100%;"
>
<a
target="_blank"
href="https://pikwizard.com/photo/global-financial-data-analysis-with-interactive-graph/9184e80b1cc1ee5a5177bbe4cb878f15/"
style="text-decoration: none; font-size: 10px; margin: 0;"
>
<img src="https://pikwizard.com/pw/medium/9184e80b1cc1ee5a5177bbe4cb878f15.jpg" style="margin: 0; width: 100%;" alt="" />
<p style="font-size: 12px; margin: 0;">PikWizard</p>
</a>
</span>
</span>
Free (free of charge)
Free for personal and commercial use.
Author: People Creations
Similar Free Stock Images

Premium


Premium

Premium


Premium


Premium

Premium


Premium


Premium


Premium


Premium
Premium

Premium


Premium


Premium


Premium


Premium


Premium


Premium


Premium


Premium


Premium


Premium

Premium


Premium


Premium


Explore More Free Stock Images