
- Home >
- Stock Photos >
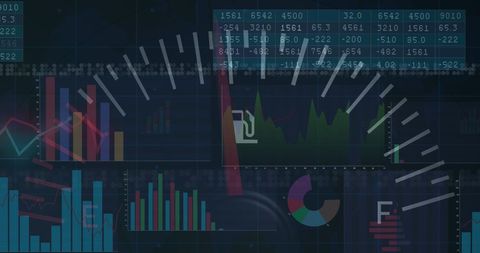
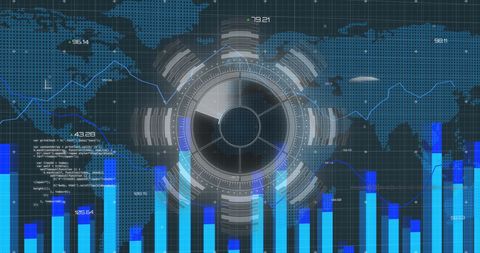
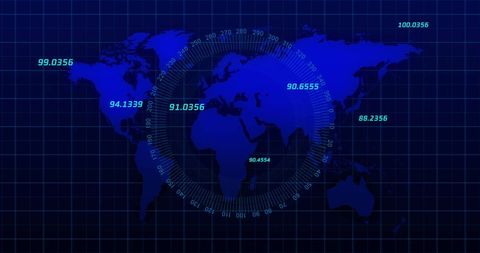
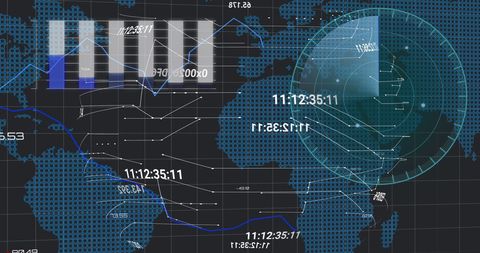
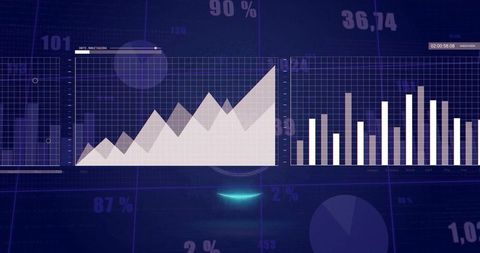
- Global Financial Data Analysis with Interactive Graphs and Radar
Global Financial Data Analysis with Interactive Graphs and Radar Image

Digitally generated concept of global finance featuring interactive graphs overlaid on a world map. Ideal for use in presentations about financial trends, business strategy sessions, and technology-driven financial services. Perfect visual for discussing global market analysis or showcasing innovations in financial data processing.
Powered by  - Get 15% off with code: PIKWIZARD15


downloads
Tags:
More
Credit Photo
If you would like to credit the Photo, here are some ways you can do so
Text Link
photo Link
<span class="text-link">
<span>
<a target="_blank" href=https://pikwizard.com/photo/global-financial-data-analysis-with-interactive-graphs-and-radar/775f511792cae737b86738aa697bf95b/>PikWizard</a>
</span>
</span>
<span class="image-link">
<span
style="margin: 0 0 20px 0; display: inline-block; vertical-align: middle; width: 100%;"
>
<a
target="_blank"
href="https://pikwizard.com/photo/global-financial-data-analysis-with-interactive-graphs-and-radar/775f511792cae737b86738aa697bf95b/"
style="text-decoration: none; font-size: 10px; margin: 0;"
>
<img src="https://pikwizard.com/pw/medium/775f511792cae737b86738aa697bf95b.jpg" style="margin: 0; width: 100%;" alt="" />
<p style="font-size: 12px; margin: 0;">PikWizard</p>
</a>
</span>
</span>
Free (free of charge)
Free for personal and commercial use.
Author: People Creations
Similar Free Stock Images

Premium


Premium


Premium


Premium

Premium


Premium


Premium


Premium

Premium


Premium


Premium


Premium


Premium

Premium

Premium


Premium


Premium

Premium

Premium


Premium


Premium


Premium


Premium


Premium


Premium


Explore More Free Stock Images