- Home >
- Stock Photos >
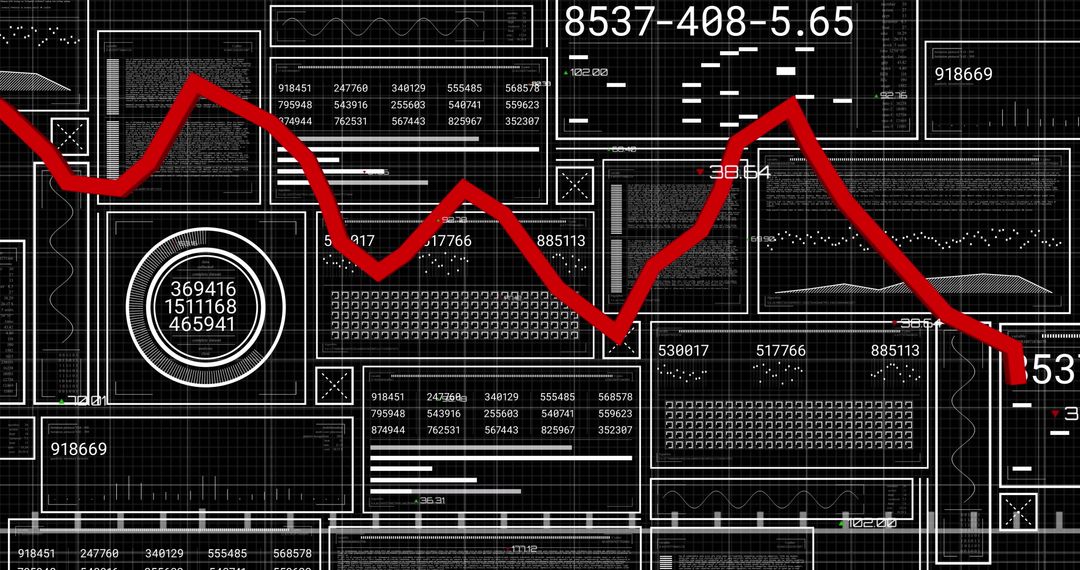
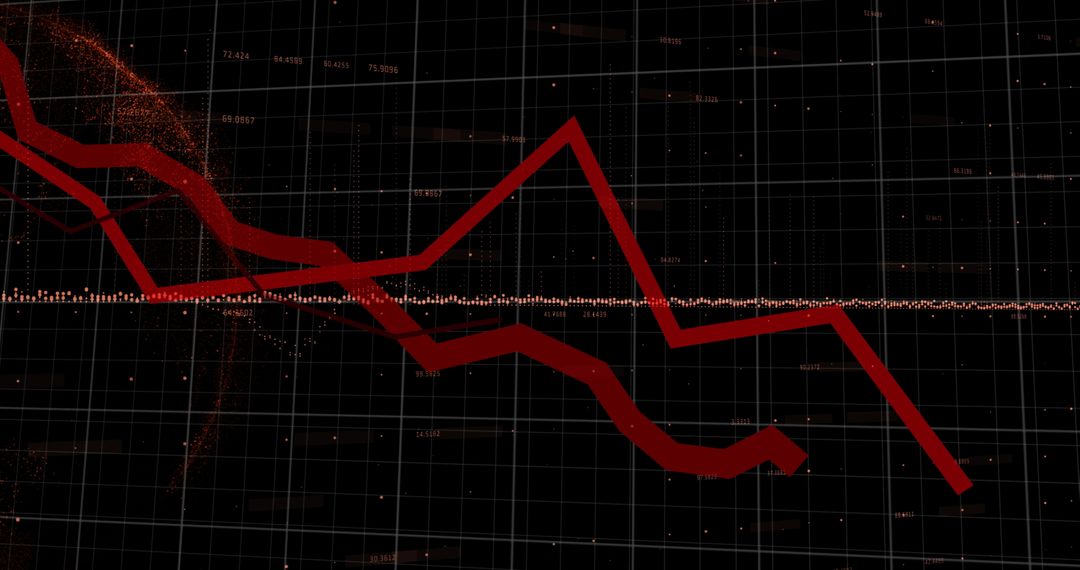
- Global Financial Data Analysis with Red Graph Vectors
Global Financial Data Analysis with Red Graph Vectors Image

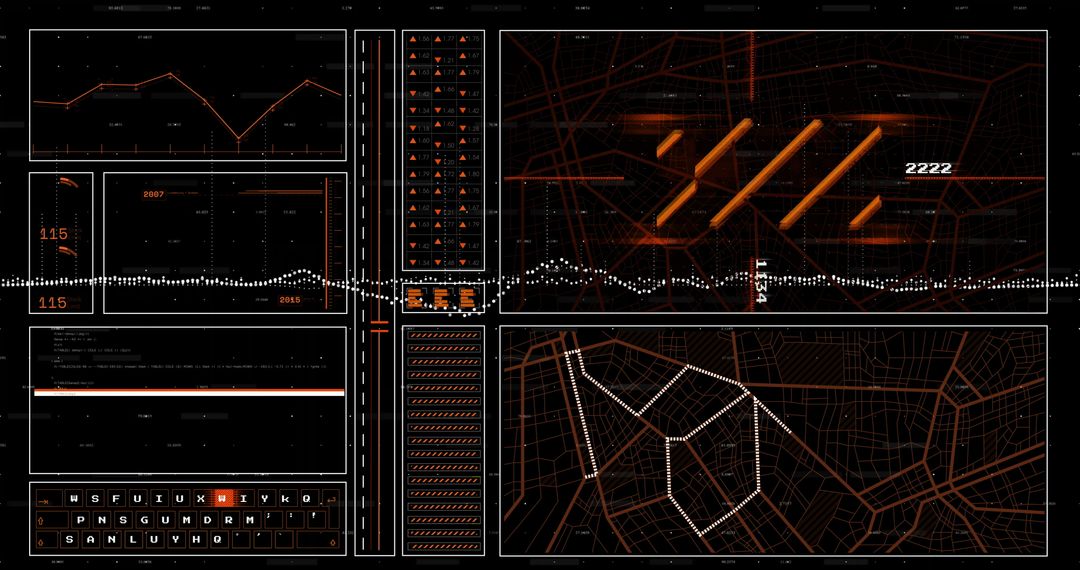
An intricate digital dashboard displays financial data with red trending lines against a global backdrop. This scene visually emphasizes data analysis in global finance, making it ideal for illustrating finance tech, market trend analysis, or presentations focused on economic strategies and innovation in digital trading and investments.
Powered by  - Get 15% off with code: PIKWIZARD15


2
downloads
downloads
Tags:
More
Credit Photo
If you would like to credit the Photo, here are some ways you can do so
Text Link
photo Link
<span class="text-link">
<span>
<a target="_blank" href=https://pikwizard.com/photo/global-financial-data-analysis-with-red-graph-vectors/bda551c74f67a6a5fff6005d2c7e9484/>PikWizard</a>
</span>
</span>
<span class="image-link">
<span
style="margin: 0 0 20px 0; display: inline-block; vertical-align: middle; width: 100%;"
>
<a
target="_blank"
href="https://pikwizard.com/photo/global-financial-data-analysis-with-red-graph-vectors/bda551c74f67a6a5fff6005d2c7e9484/"
style="text-decoration: none; font-size: 10px; margin: 0;"
>
<img src="https://pikwizard.com/pw/medium/bda551c74f67a6a5fff6005d2c7e9484.jpg" style="margin: 0; width: 100%;" alt="" />
<p style="font-size: 12px; margin: 0;">PikWizard</p>
</a>
</span>
</span>
Free (free of charge)
Free for personal and commercial use.
Author: Creative Art
Similar Free Stock Images

Premium


Premium


Premium


Premium


Premium


Premium


Premium


Premium


Premium


Premium


Premium


Premium


Premium


Premium


Premium


Premium


Premium


Premium


Premium


Premium


Premium


Premium


Premium


Premium